DNA Hub

Sample report

What the AI DNA reports look like

Each report opens in the browser and prints as a clean A4 PDF with the clinic's logo and details. The examples below use synthetic data.

The full sample report, page by page

An 11-page DNA test interpretation made from synthetic test data, exactly as a clinic receives it. The patient name is a placeholder. Select a page to open it at full size.
Download the sample PDF (11 pages, 2.4 MB)
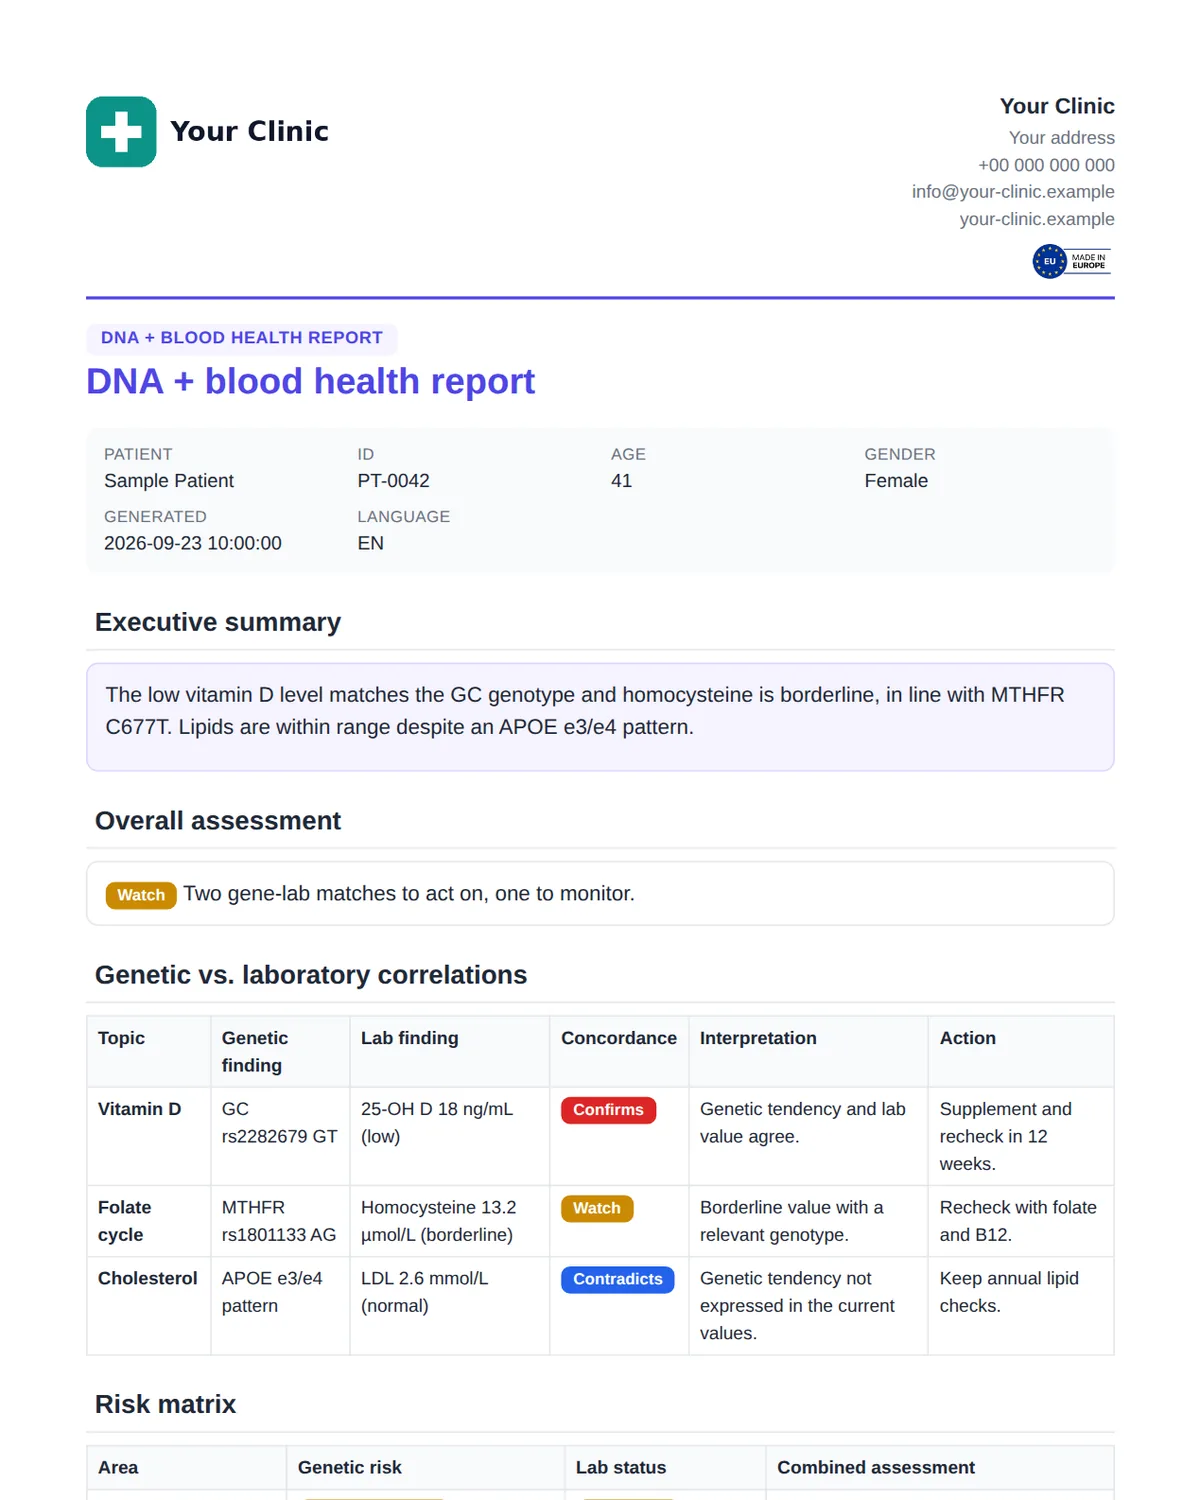
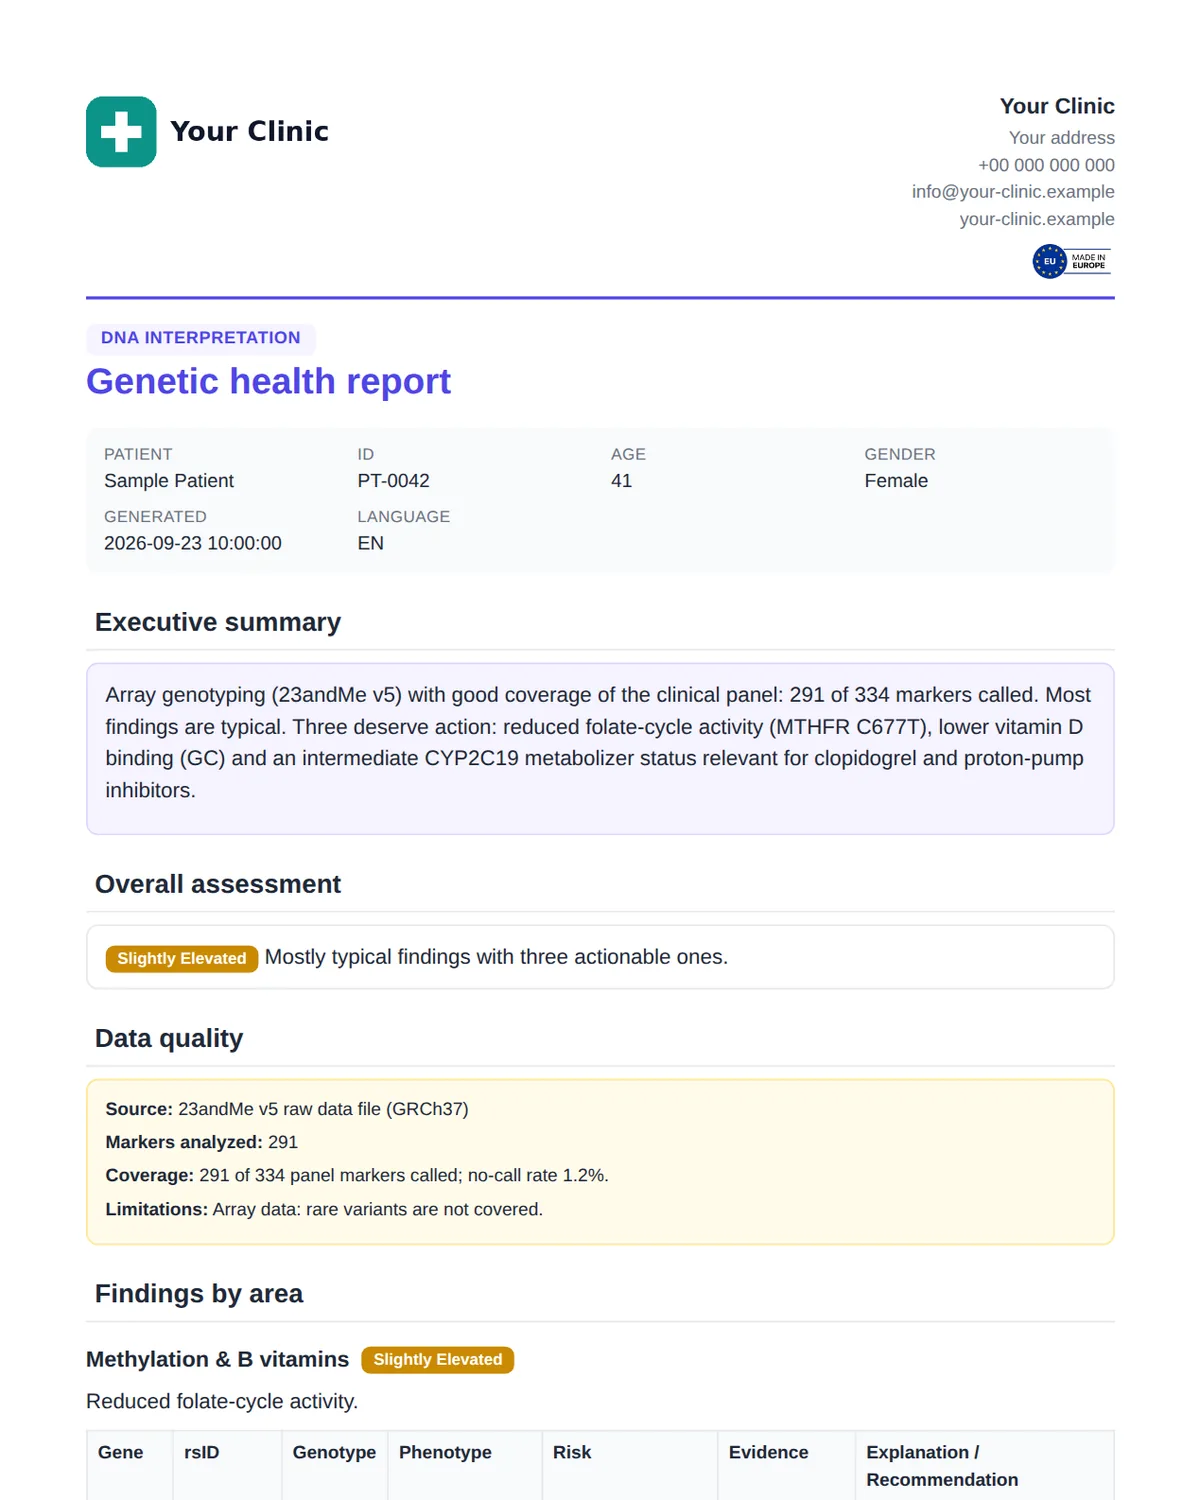
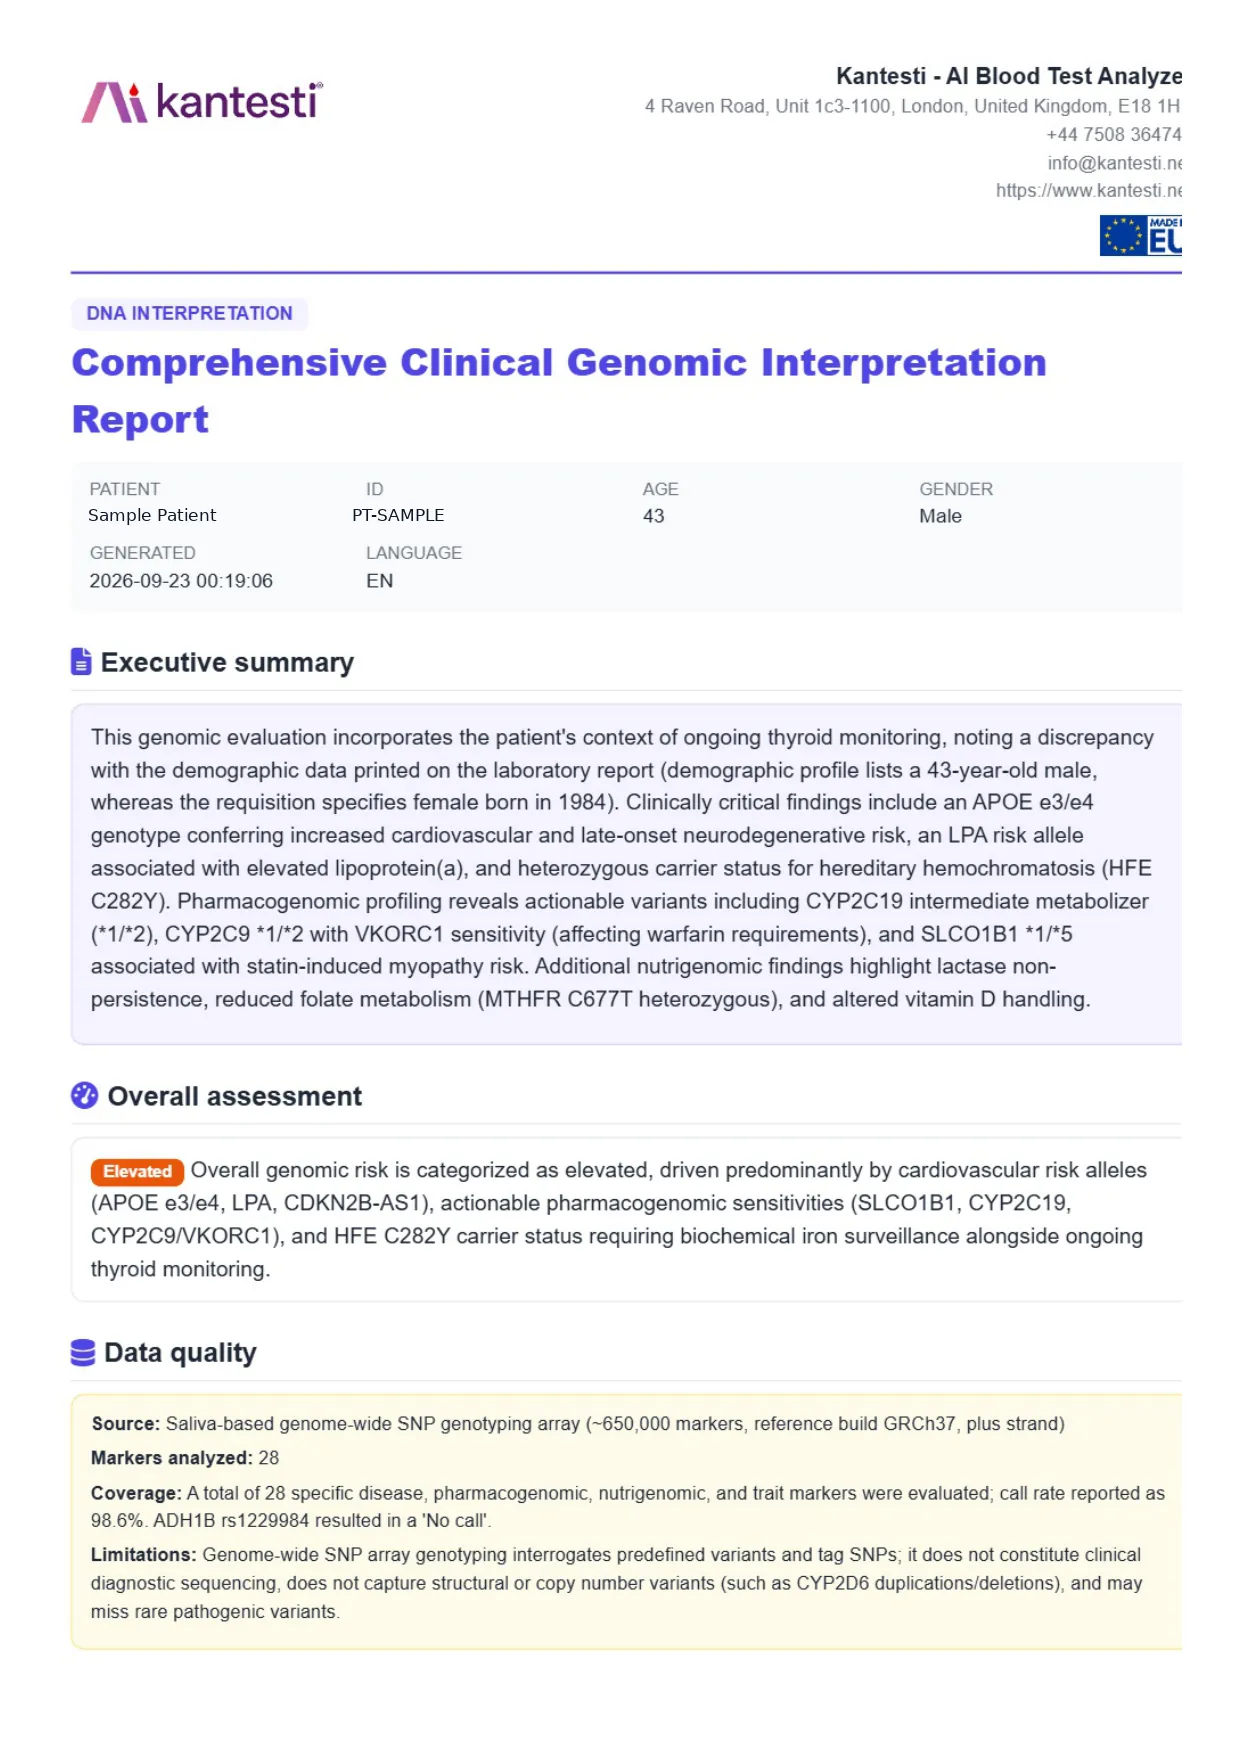
  1. Sample AI DNA test interpretation report, page 1: executive summary, overall assessment and data quality 1
    Page 1 · Summary, overall assessment and data qualityClinic header, patient details, the executive summary, an overall assessment driven by APOE, LPA and CDKN2B-AS1, and the data-quality box: genotyping array, build GRCh37, call rate.
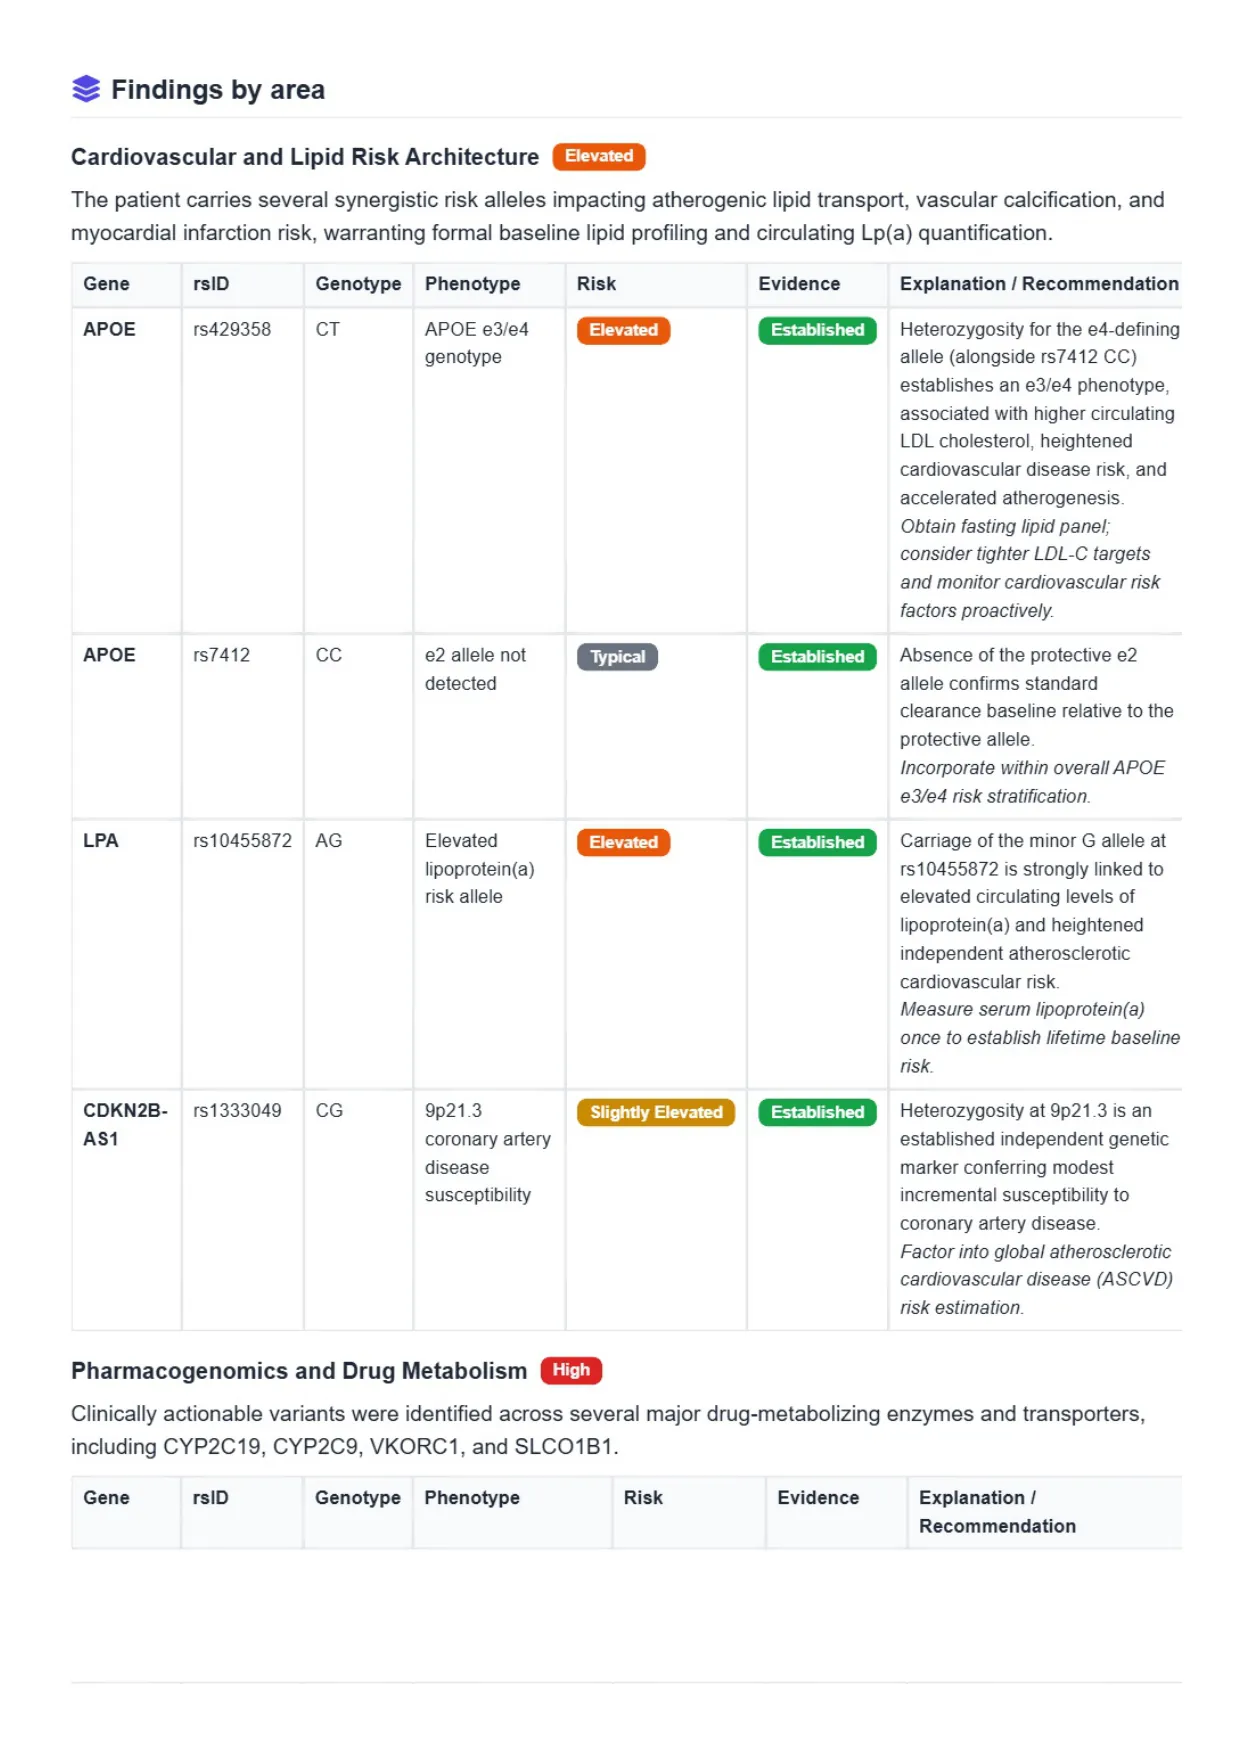
  2. Sample DNA report, page 2: cardiovascular and lipid findings for APOE, LPA and CDKN2B-AS1 with risk and evidence levels 2
    Page 2 · Cardiovascular and lipid findingsFindings by area start with cardiovascular and lipid risk: APOE e3/e4, an elevated lipoprotein(a) allele and the 9p21.3 marker, each with risk level, evidence level and a recommendation.
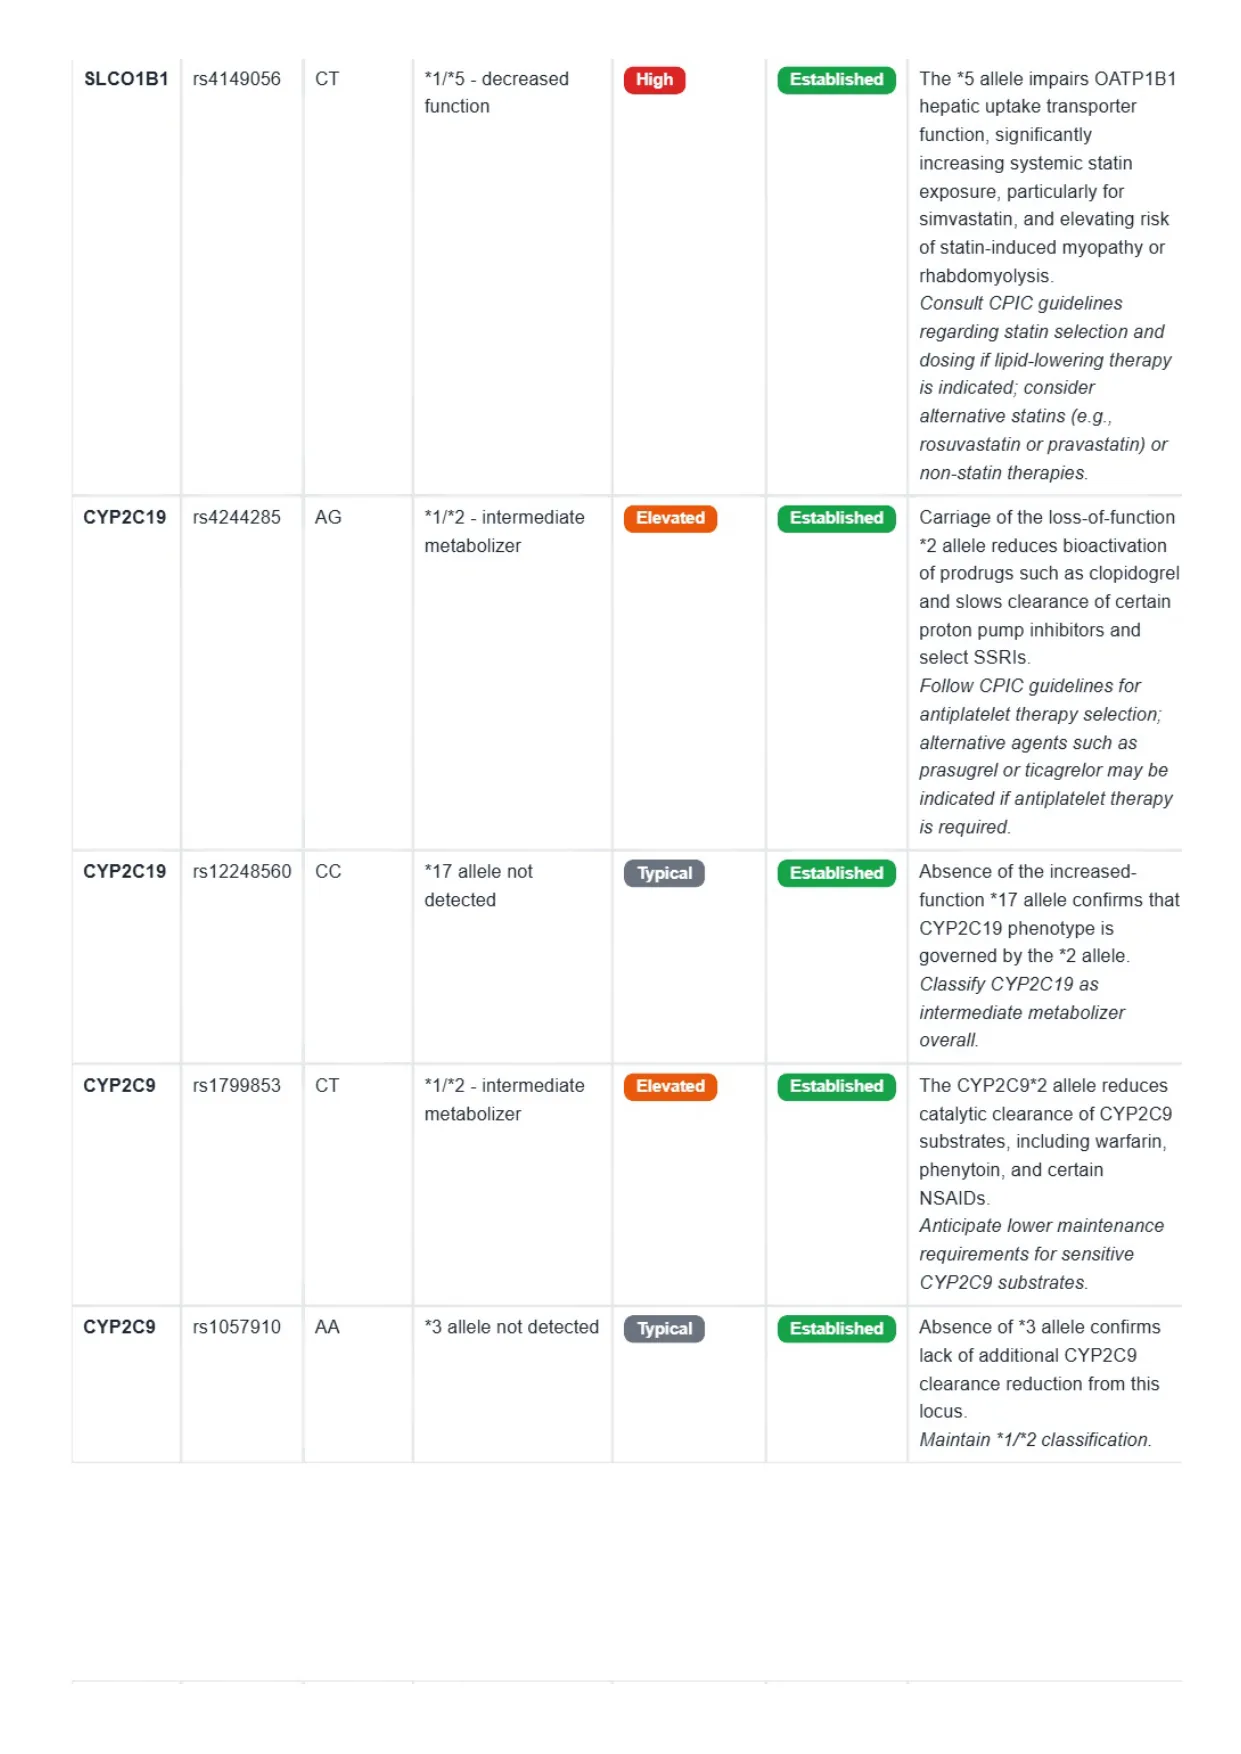
  3. Sample DNA report, page 3: pharmacogenomic findings for SLCO1B1, CYP2C19 and CYP2C9 with CPIC-style guidance 3
    Page 3 · Pharmacogenomics: SLCO1B1, CYP2C19, CYP2C9Drug-response findings: SLCO1B1 decreased function for statins, CYP2C19 intermediate metabolizer for clopidogrel and PPIs, and CYP2C9 intermediate metabolizer.
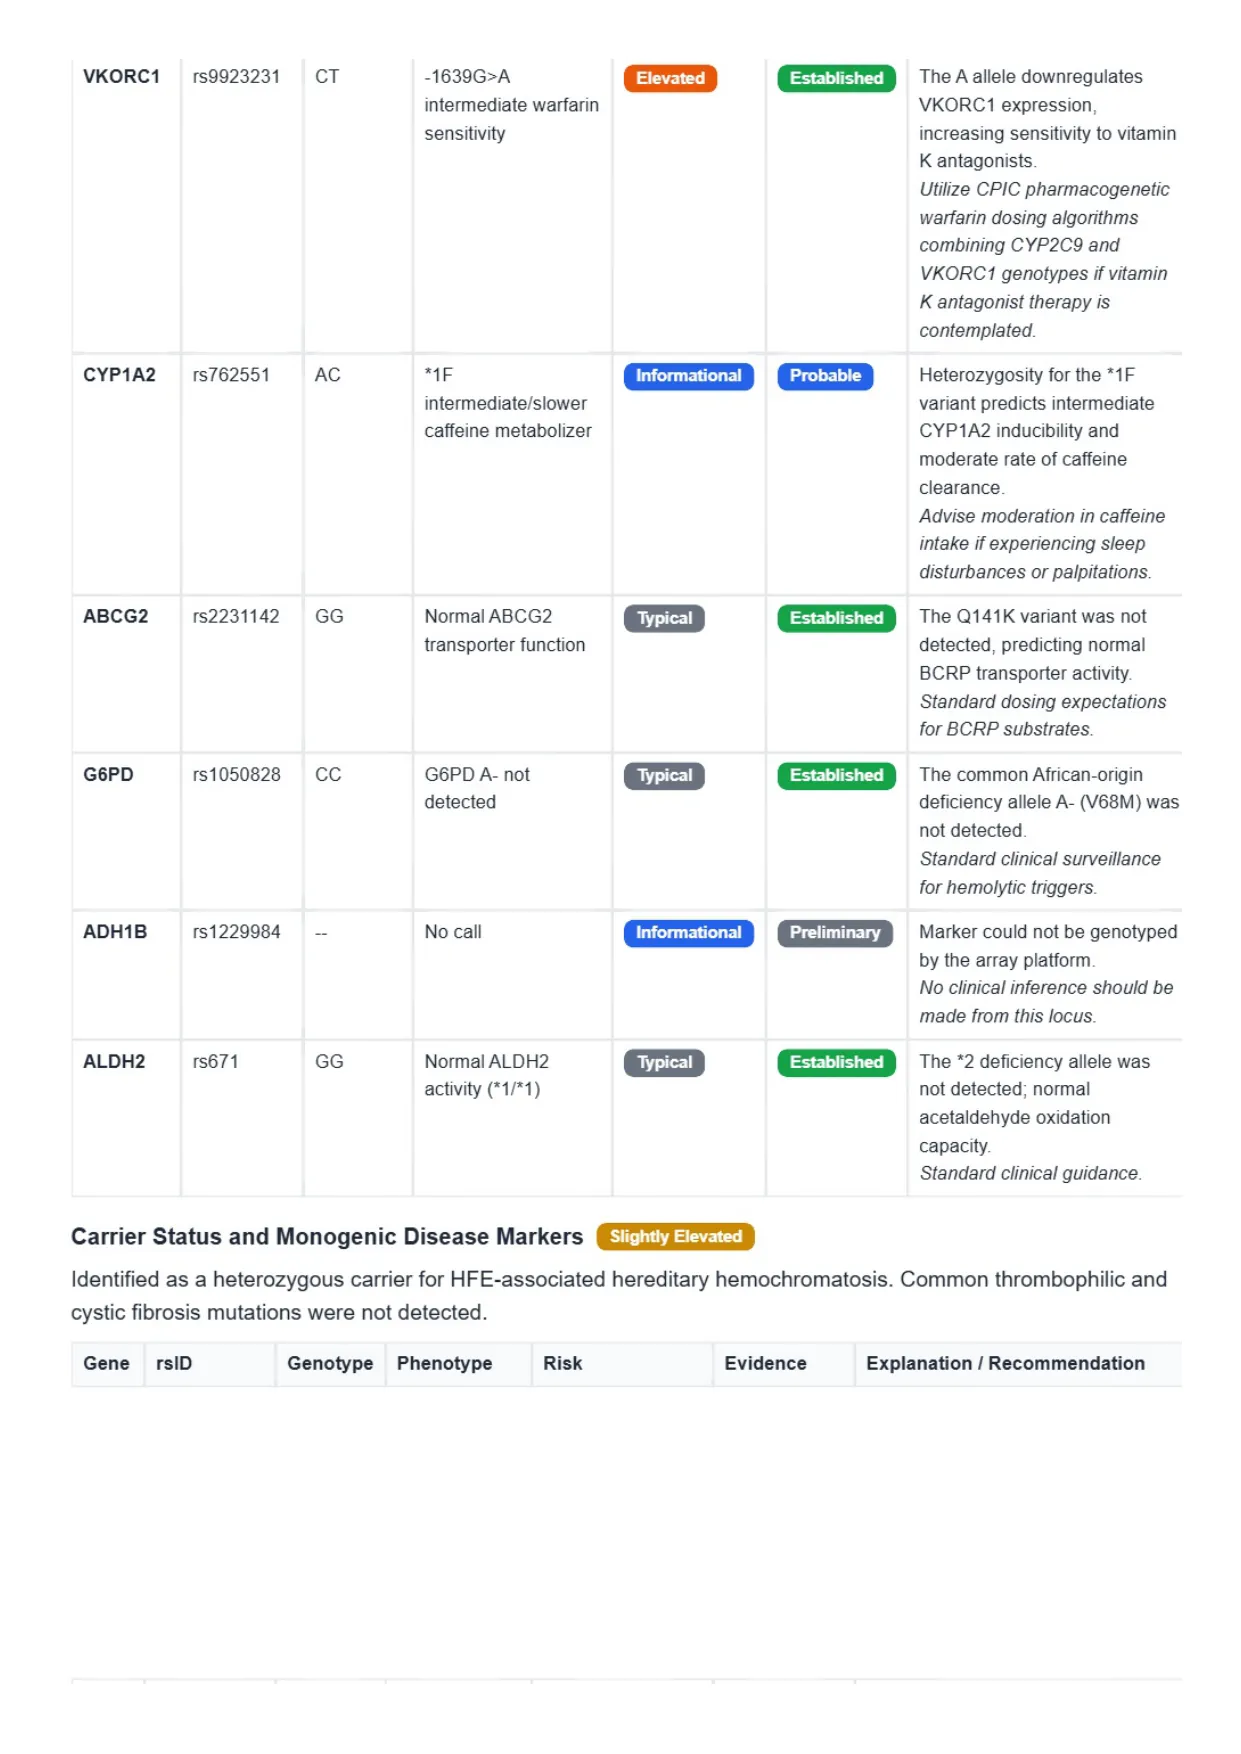
  4. Sample DNA report, page 4: VKORC1, CYP1A2, ABCG2, G6PD and ALDH2 findings and the start of carrier status markers 4
    Page 4 · Warfarin, caffeine and other drug-response markersVKORC1 warfarin sensitivity, CYP1A2 caffeine metabolism, ABCG2, G6PD and ALDH2, a marker the array could not call, and the start of carrier status and monogenic markers.
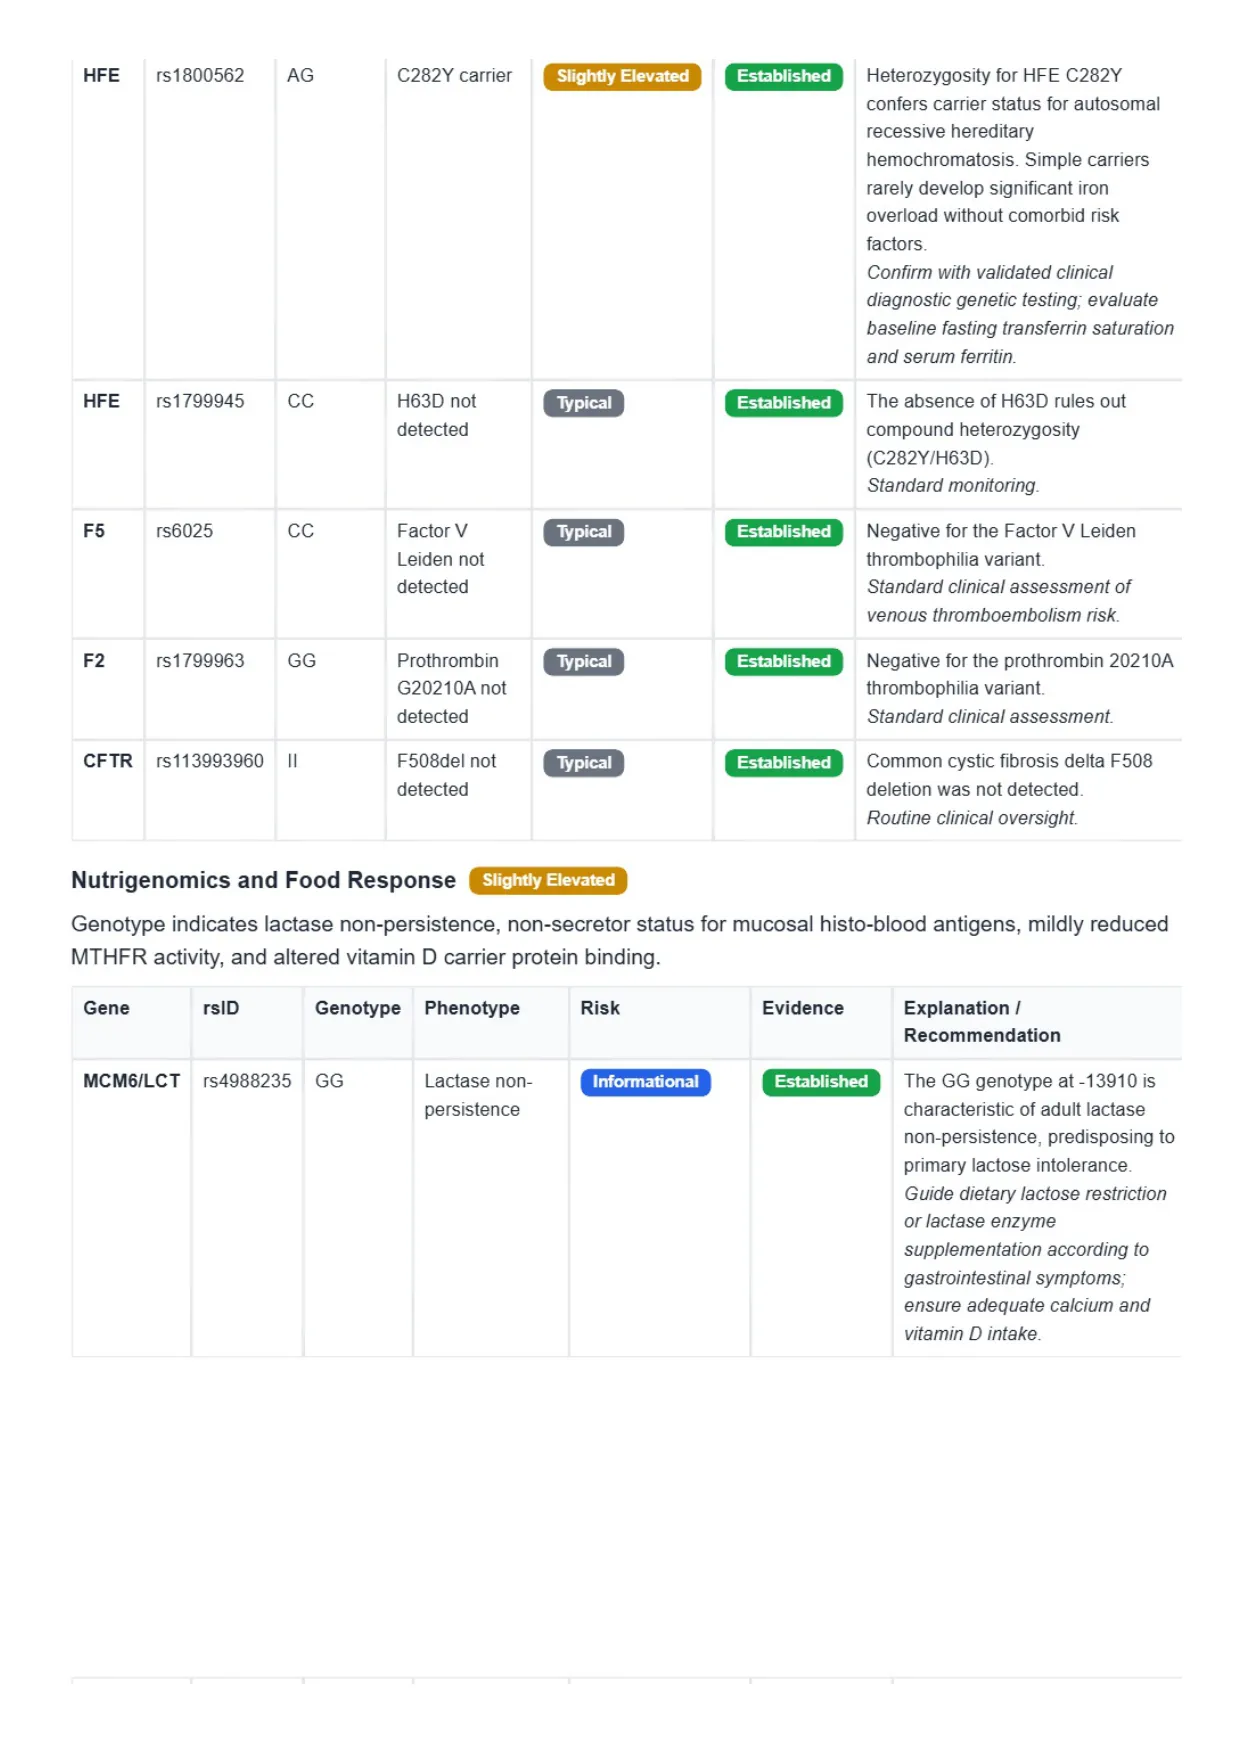
  5. Sample DNA report, page 5: HFE haemochromatosis carrier, thrombophilia markers, CFTR and lactase persistence 5
    Page 5 · Carrier status, thrombophilia and lactaseHFE C282Y carrier status with confirmation advice, Factor V Leiden and prothrombin not detected, CFTR F508del not detected, and lactase non-persistence under nutrigenomics.
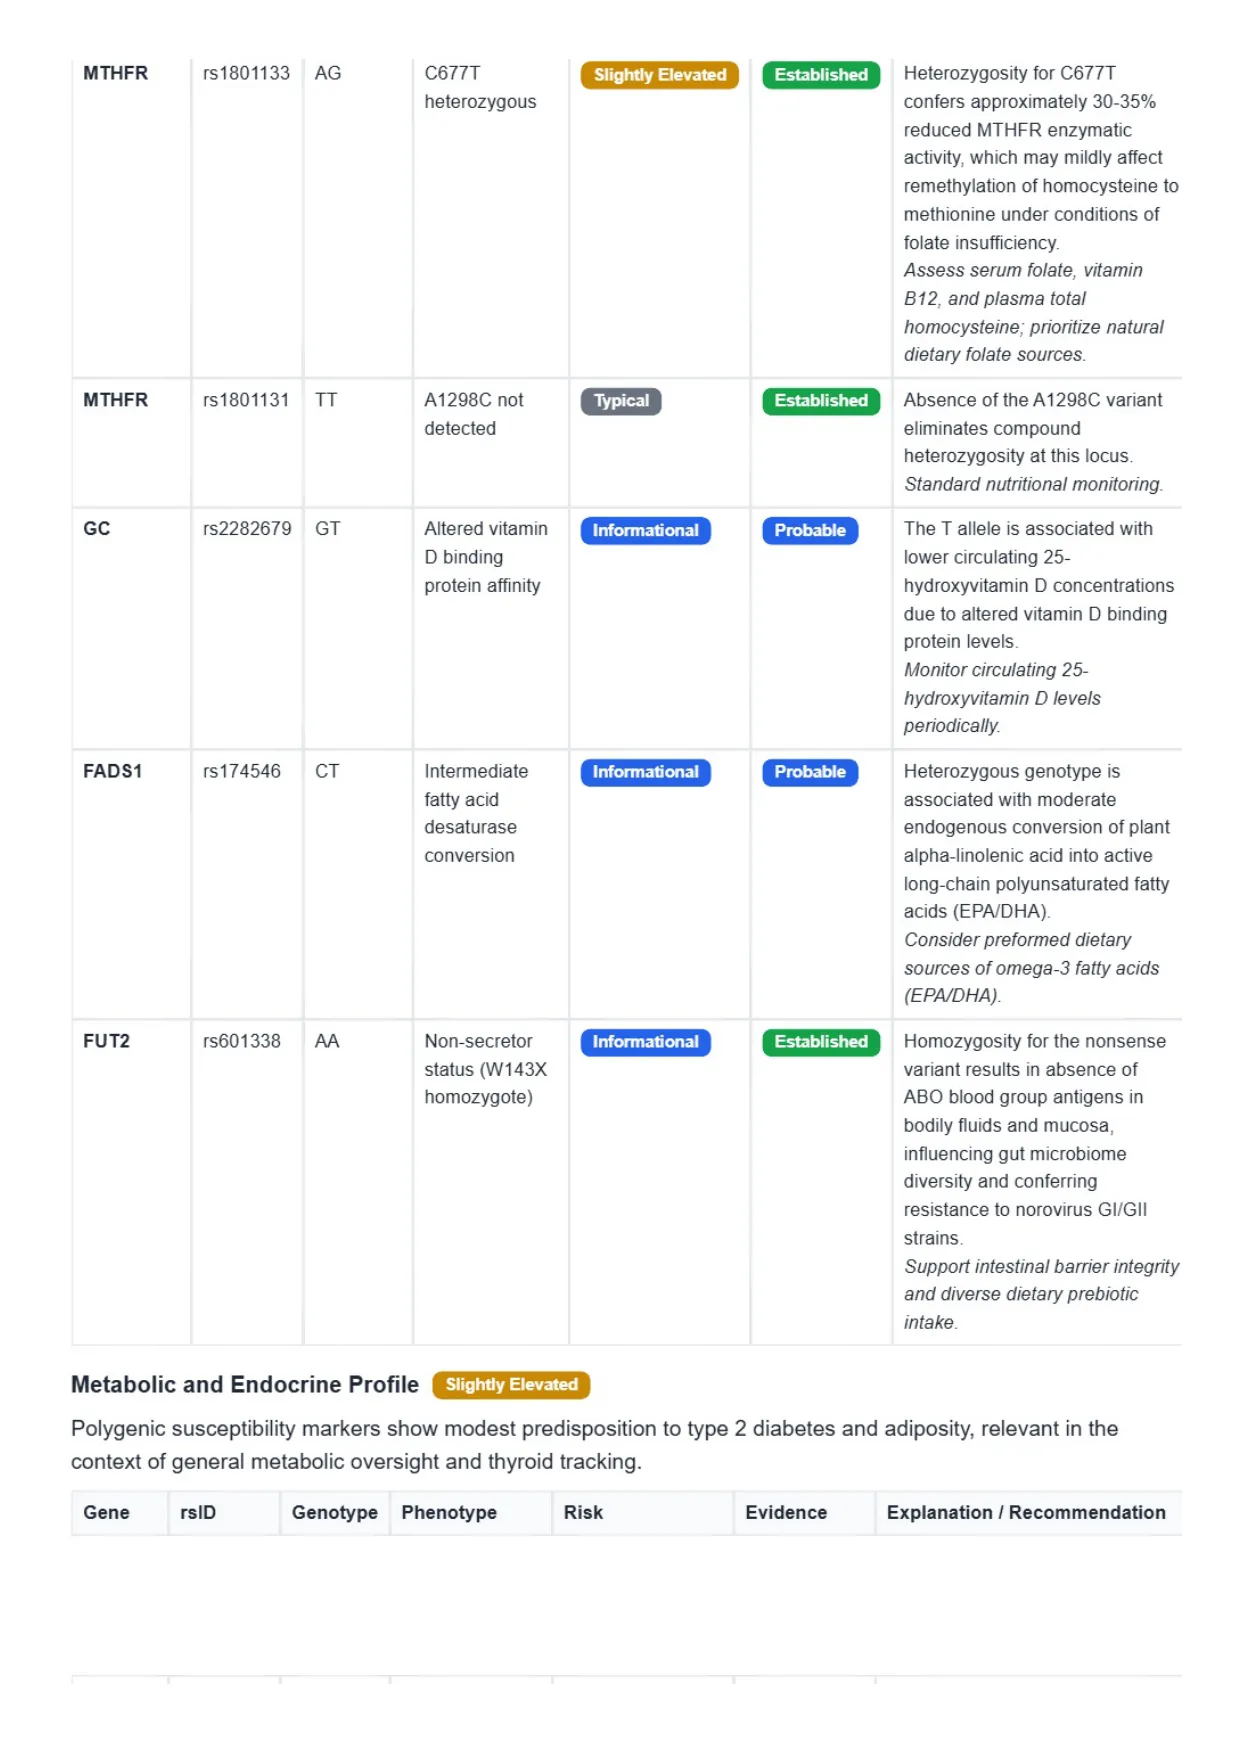
  6. Sample DNA report, page 6: MTHFR, vitamin D binding, omega-3 conversion and FUT2 nutrigenomic findings 6
    Page 6 · Folate, vitamin D and omega-3 metabolismMTHFR C677T heterozygous, GC variant for lower vitamin D binding, FADS1 omega-3 conversion and FUT2 non-secretor status, then the metabolic and endocrine profile.
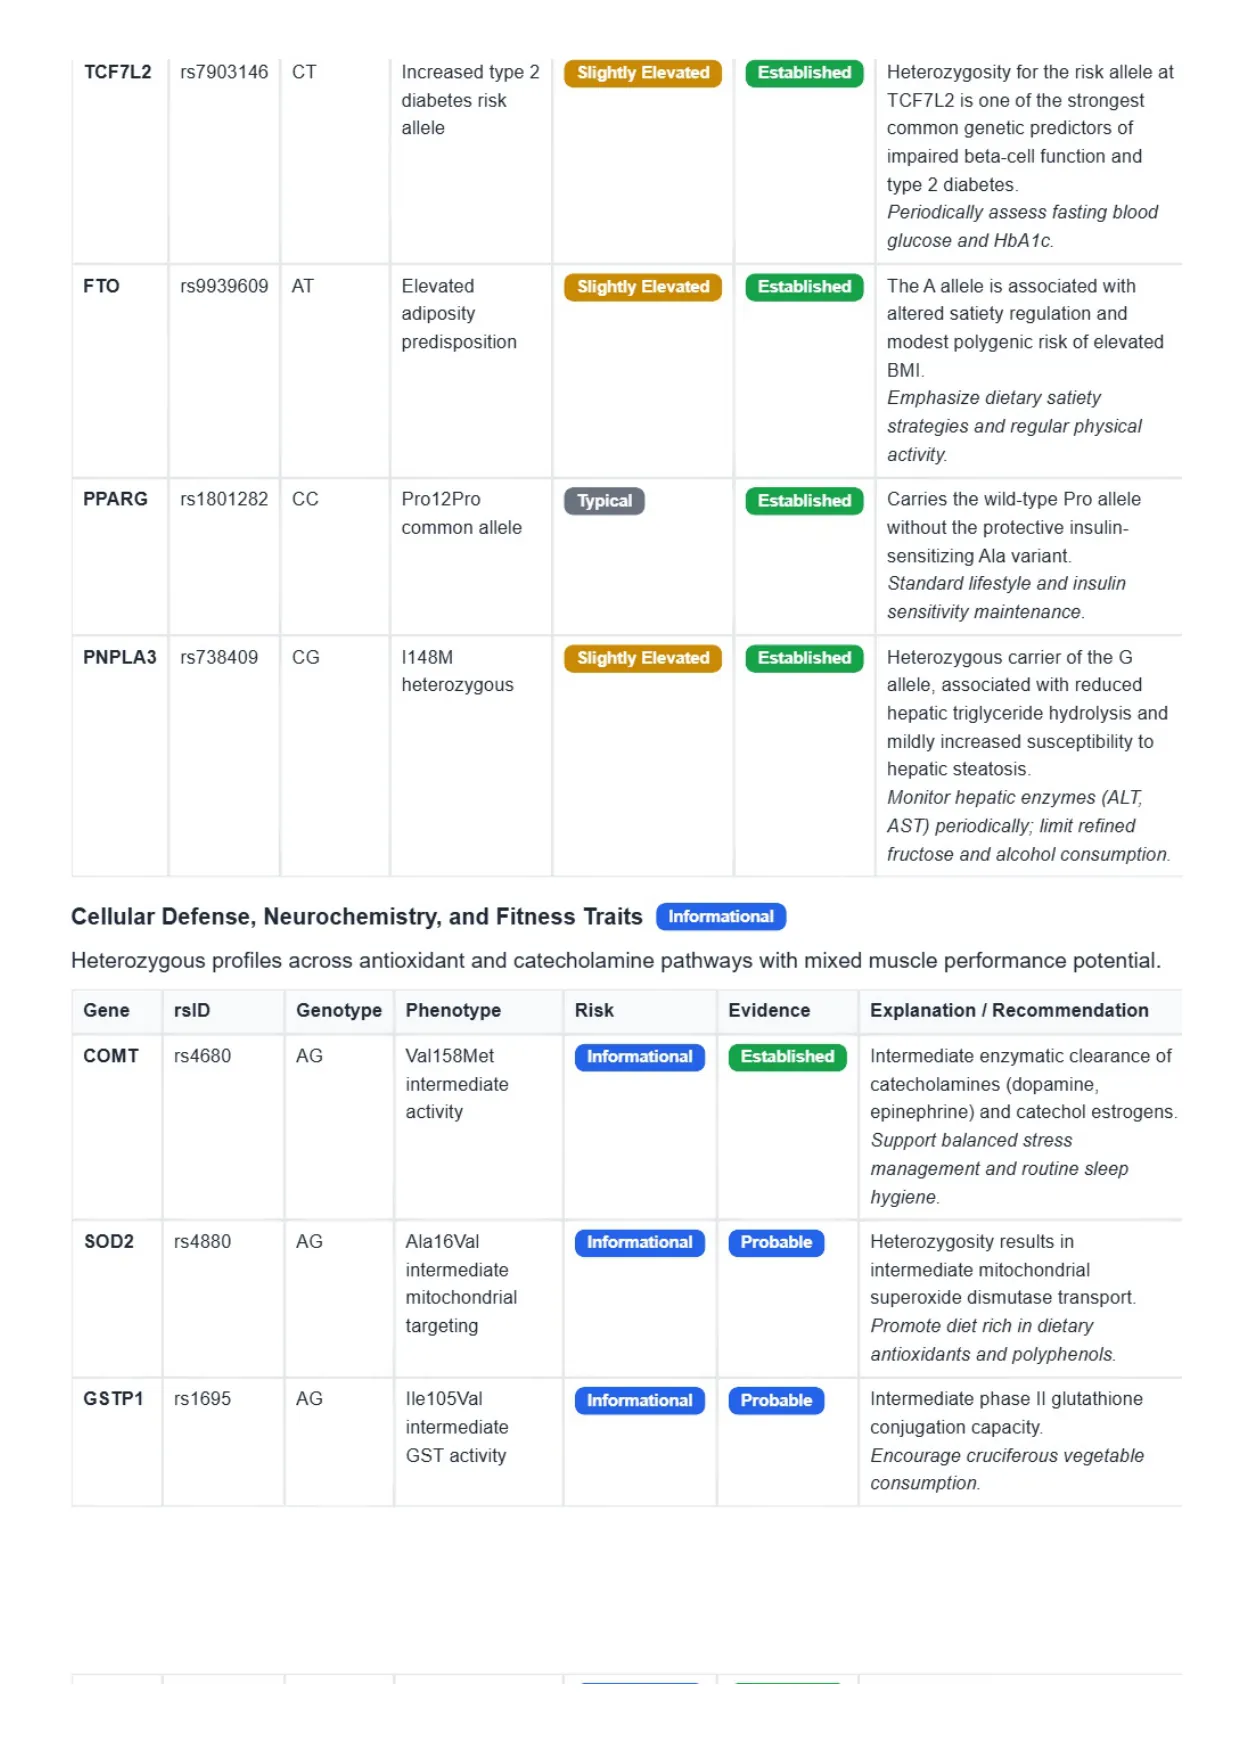
  7. Sample DNA report, page 7: type 2 diabetes, weight, liver fat and neurochemistry markers such as TCF7L2, FTO and COMT 7
    Page 7 · Metabolic, neurochemistry and fitness traitsTCF7L2, FTO, PPARG and PNPLA3 metabolic findings, then COMT, SOD2 and GSTP1 in the cellular defence, neurochemistry and fitness section.
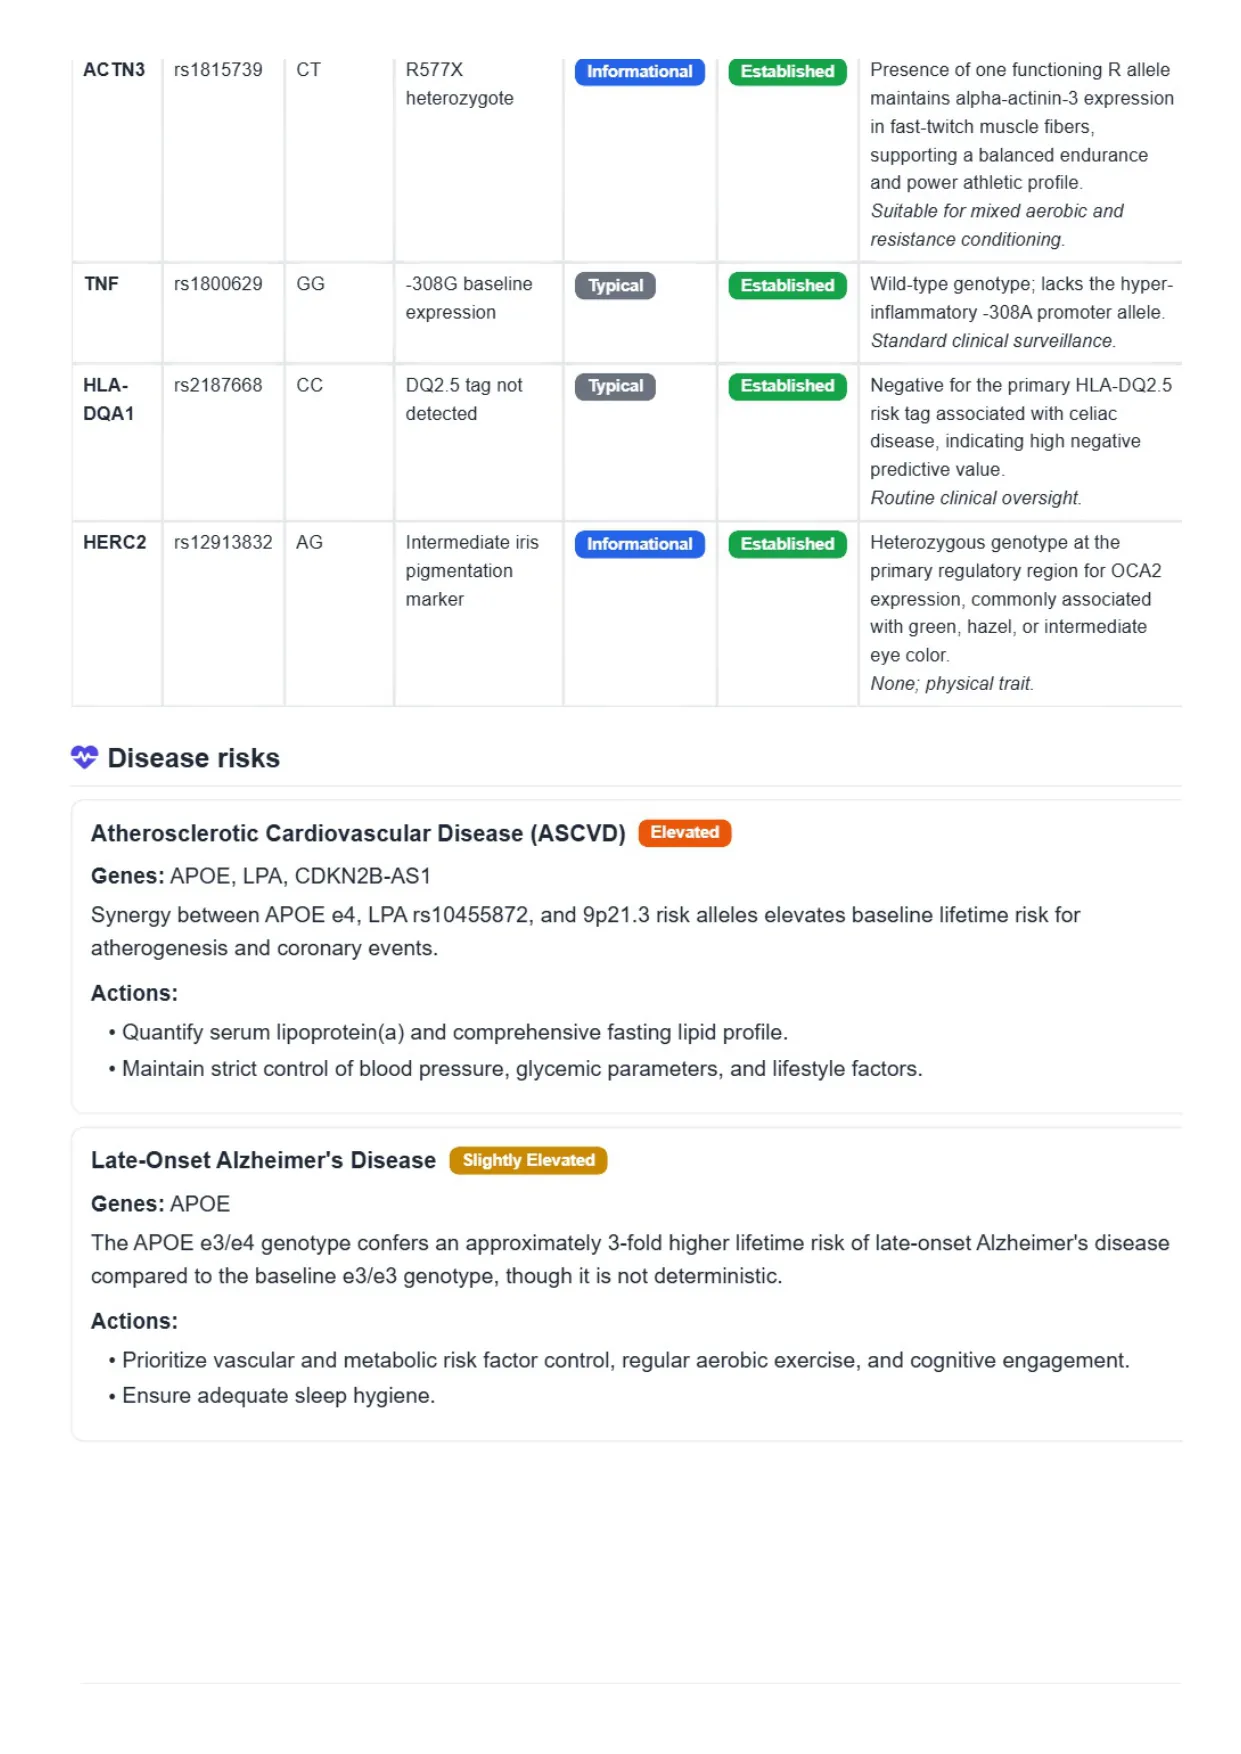
  8. Sample DNA report, page 8: disease risks for atherosclerotic cardiovascular disease and late-onset Alzheimer's 8
    Page 8 · Disease risks with genes and actionsACTN3, TNF, HLA-DQA1 and HERC2 findings, then disease risks with the genes behind them and concrete actions: atherosclerotic cardiovascular disease and late-onset Alzheimer's disease.
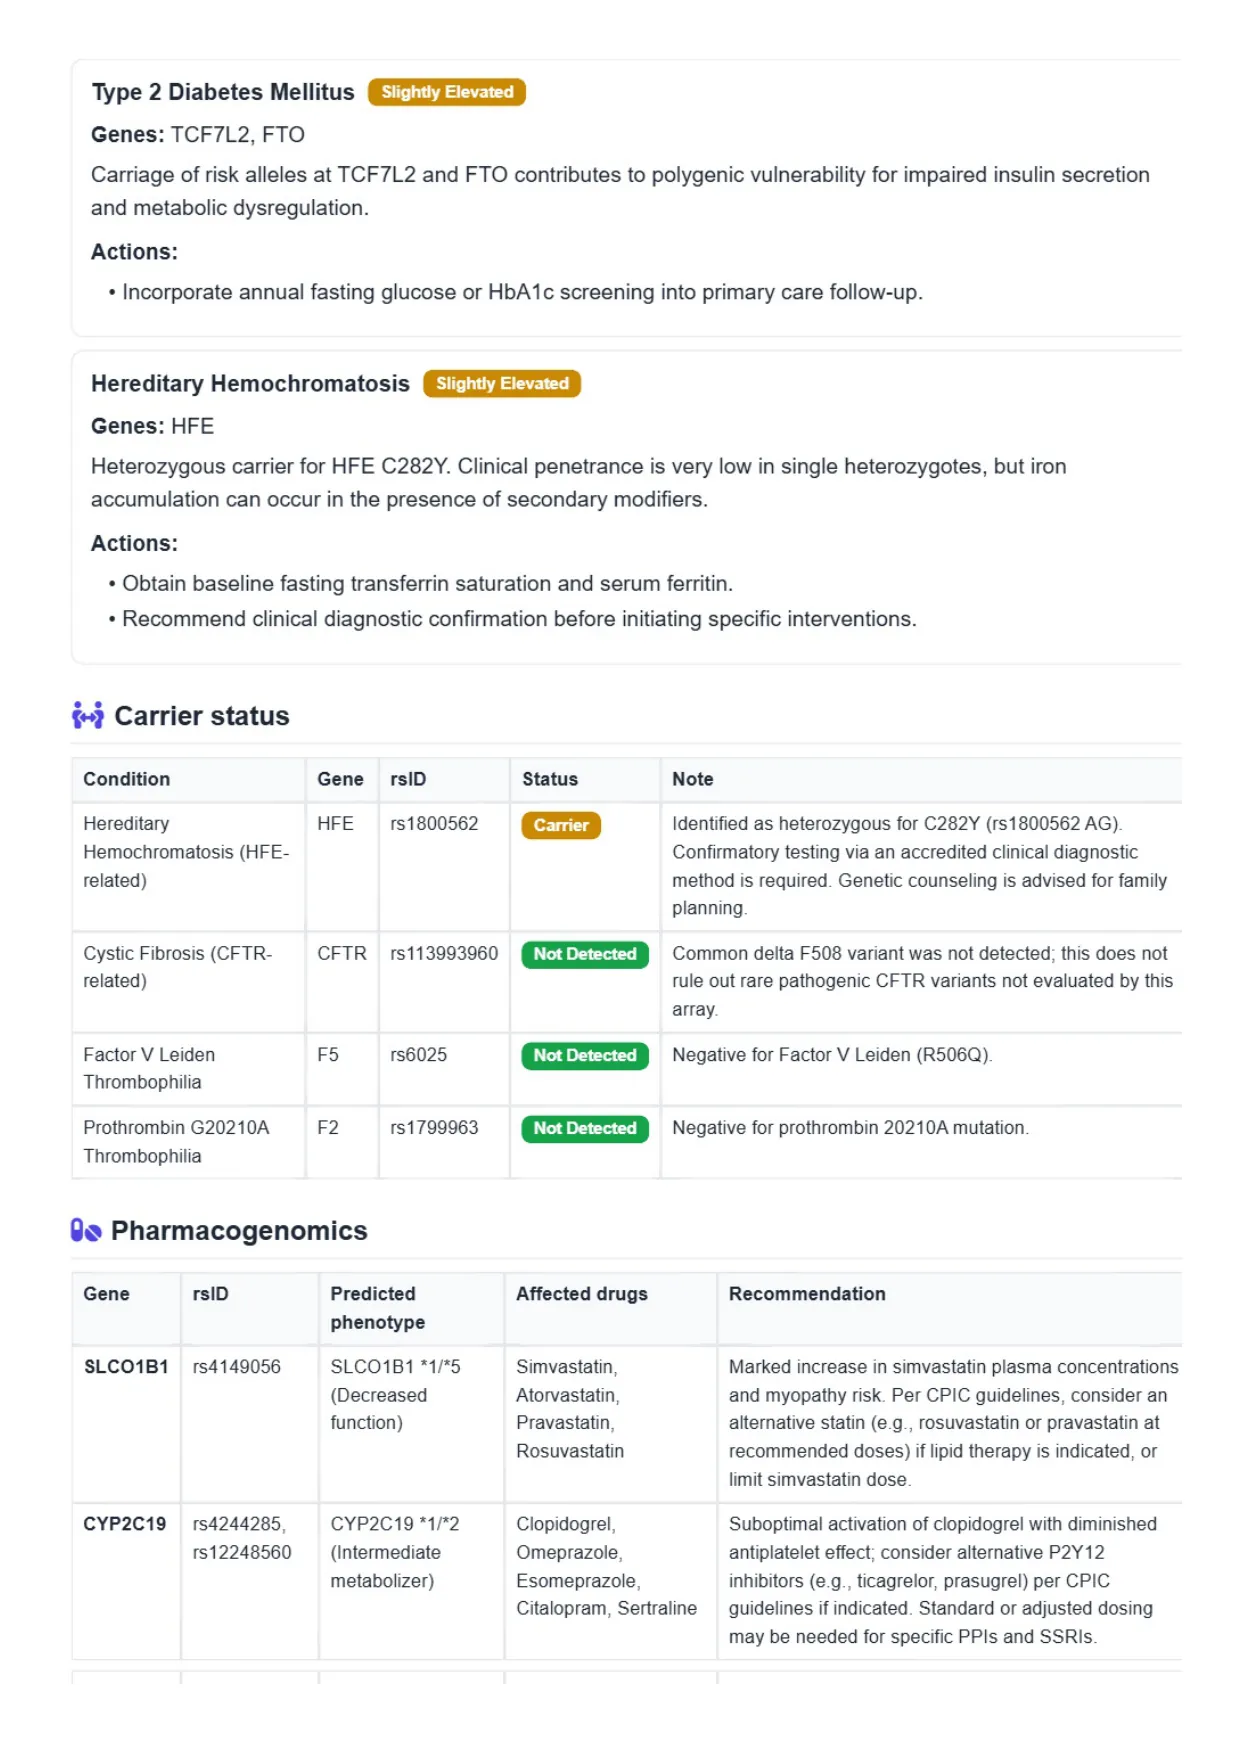
  9. Sample DNA report, page 9: carrier status table and pharmacogenomics summary with affected drugs 9
    Page 9 · Carrier status and pharmacogenomics tablesType 2 diabetes and haemochromatosis risk cards, the carrier status table (HFE carrier; CFTR, Factor V and prothrombin not detected) and the pharmacogenomics table with affected drugs.
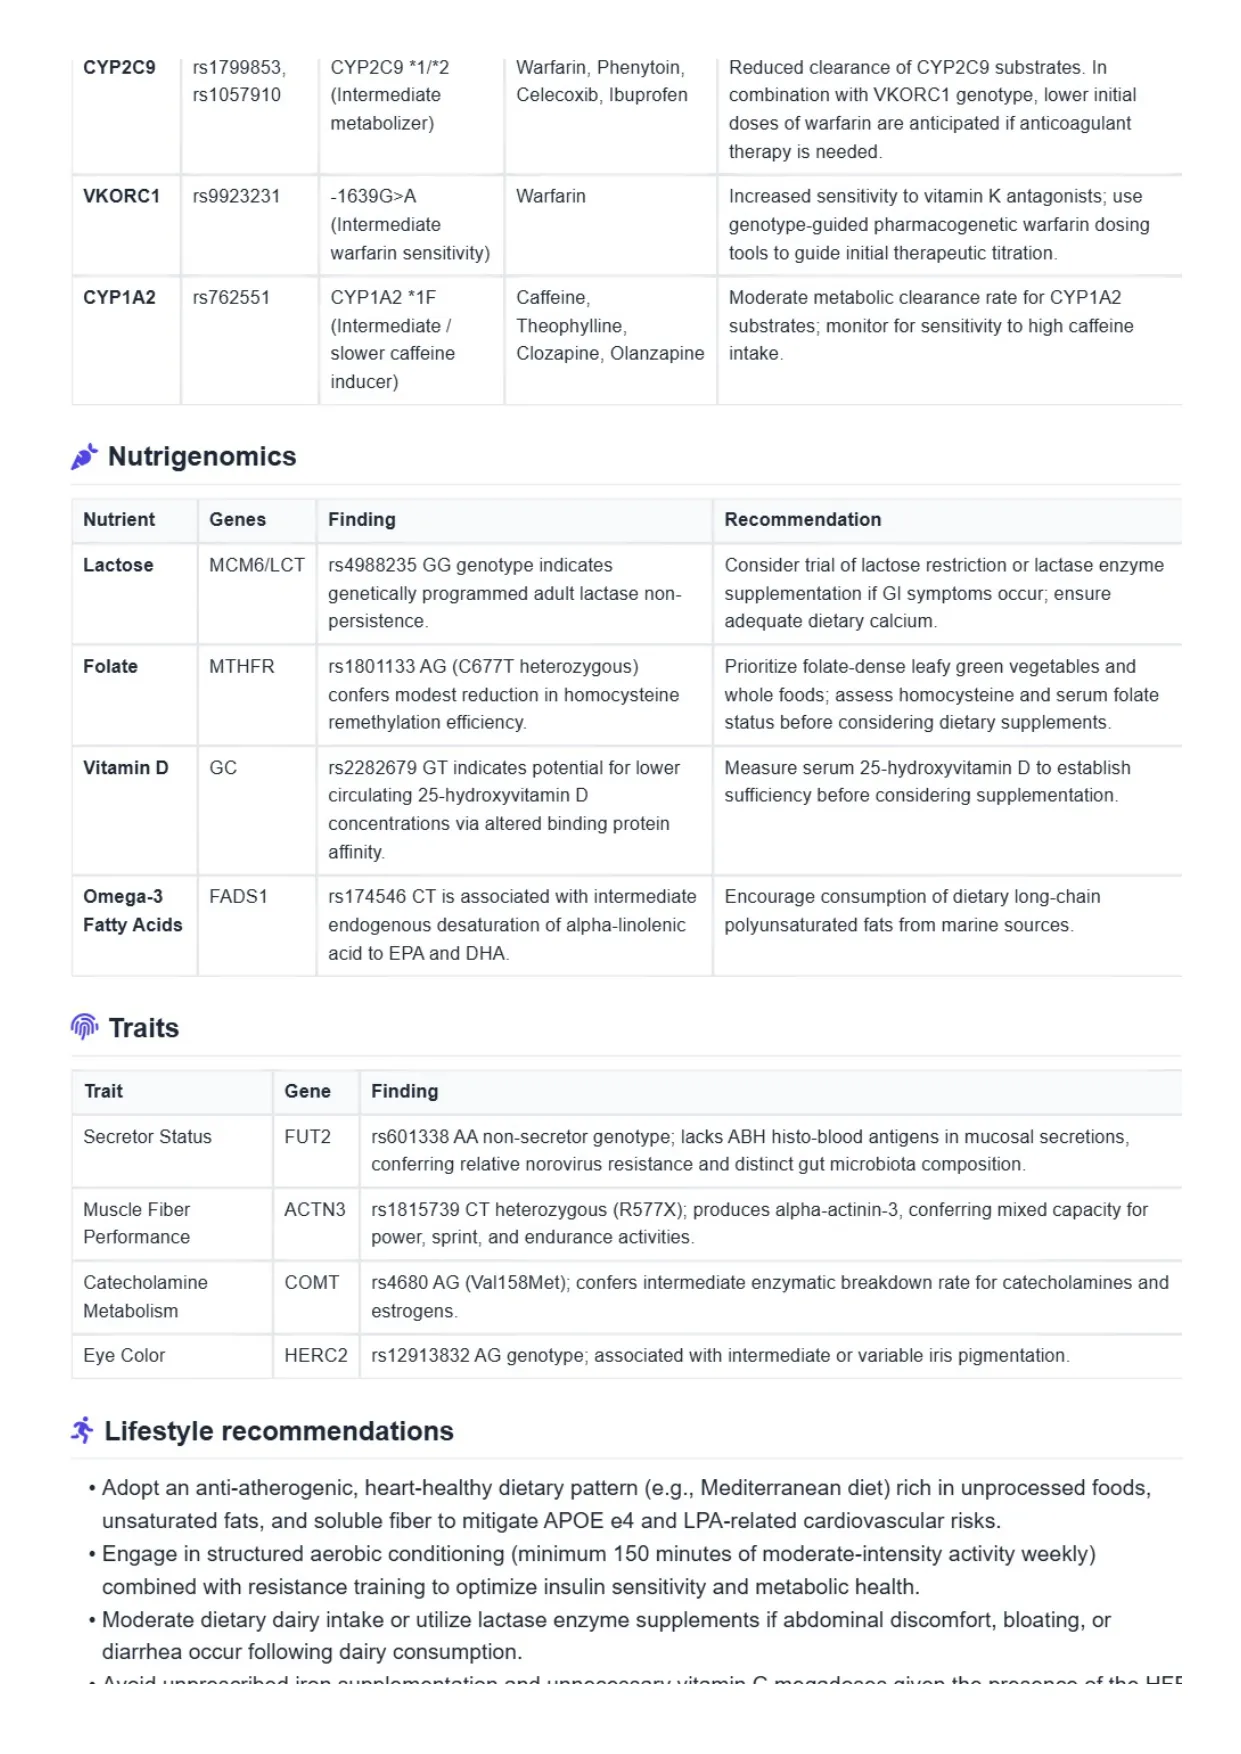
  10. Sample DNA report, page 10: nutrigenomics, traits and lifestyle recommendations from the genetic findings 10
    Page 10 · Nutrigenomics, traits and lifestyleDrug-response summary for CYP2C9, VKORC1 and CYP1A2, nutrigenomics for lactose, folate, vitamin D and omega-3, traits, and lifestyle recommendations tied to the findings.
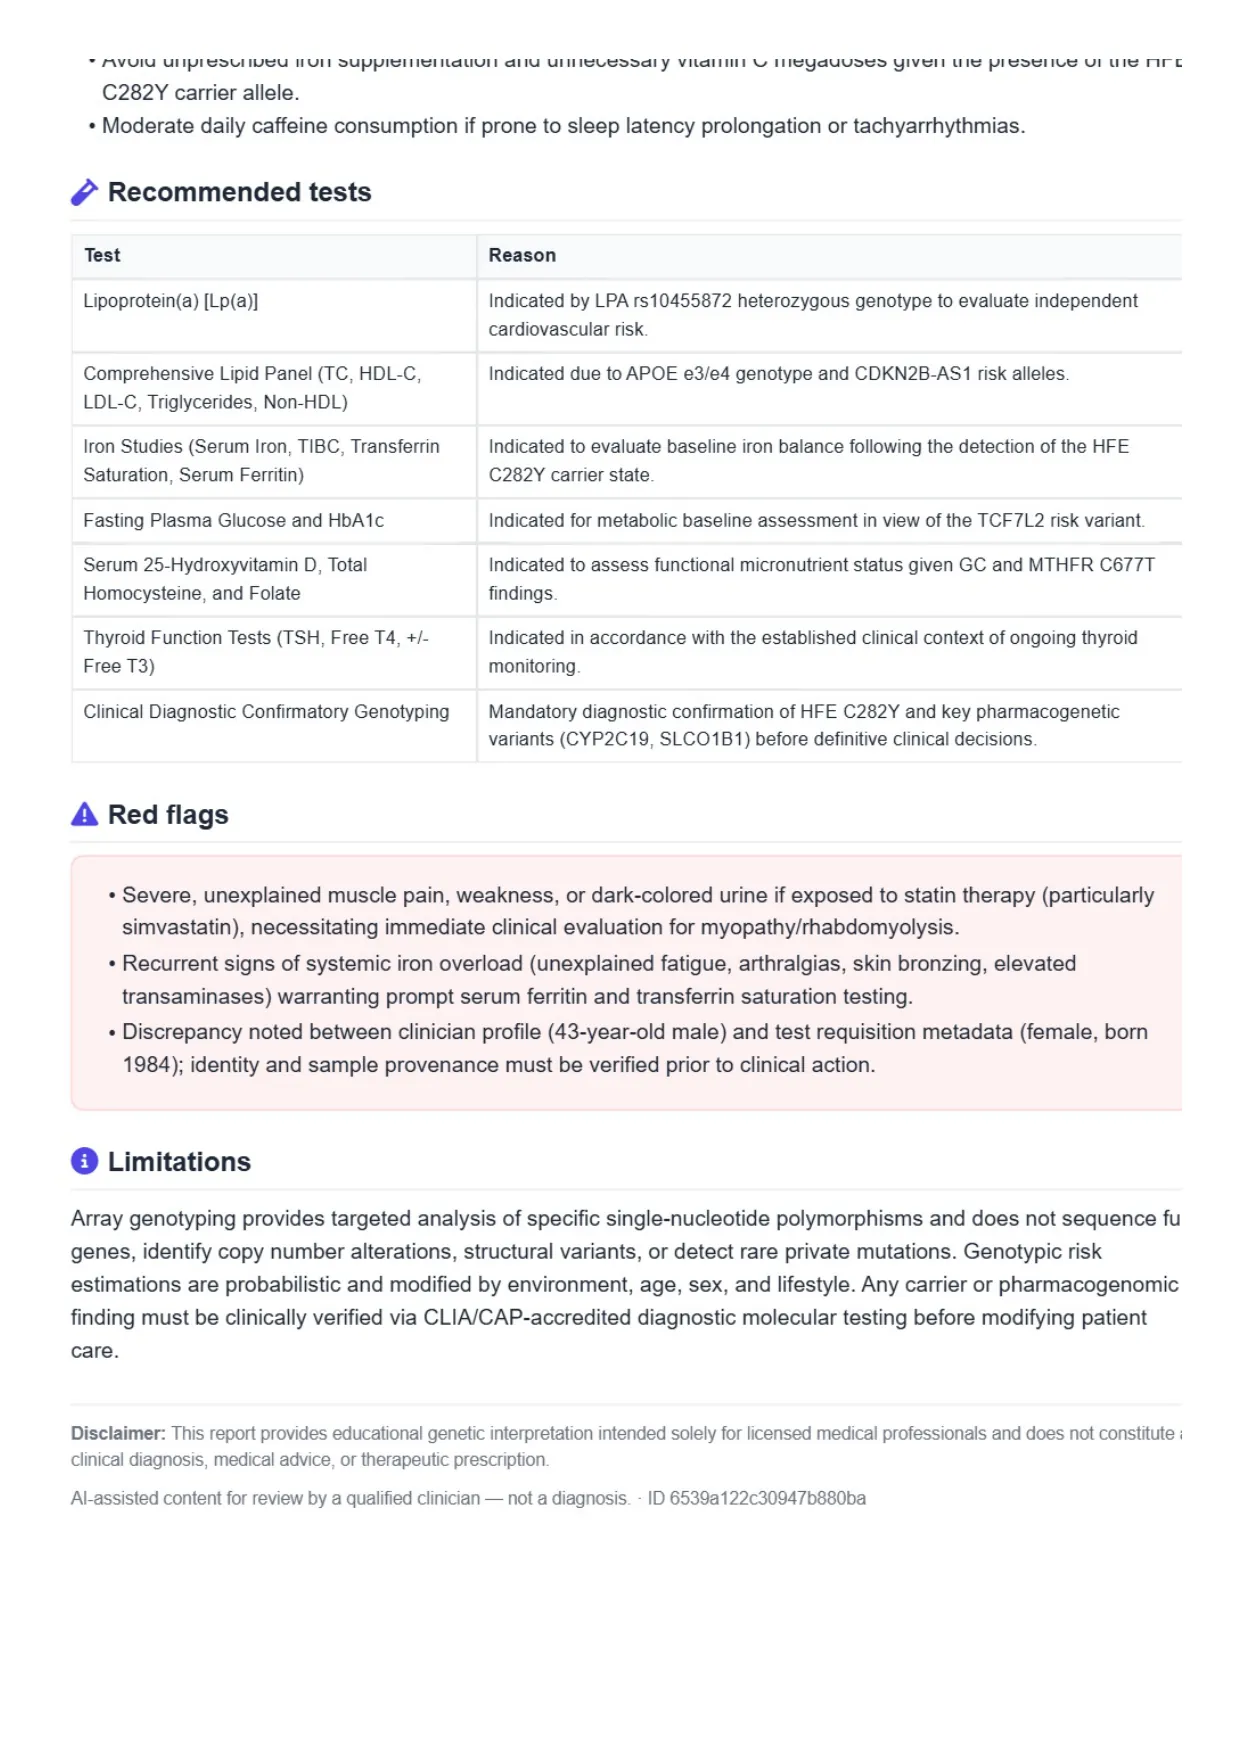
  11. Sample DNA report, page 11: recommended follow-up tests, red flags, limitations and the clinical disclaimer 11
    Page 11 · Follow-up tests, red flags and limitationsRecommended tests with reasons, red flags including an identity check between the patient profile and the laboratory requisition, the limitations of array genotyping and the disclaimer.

On every screen and on paper

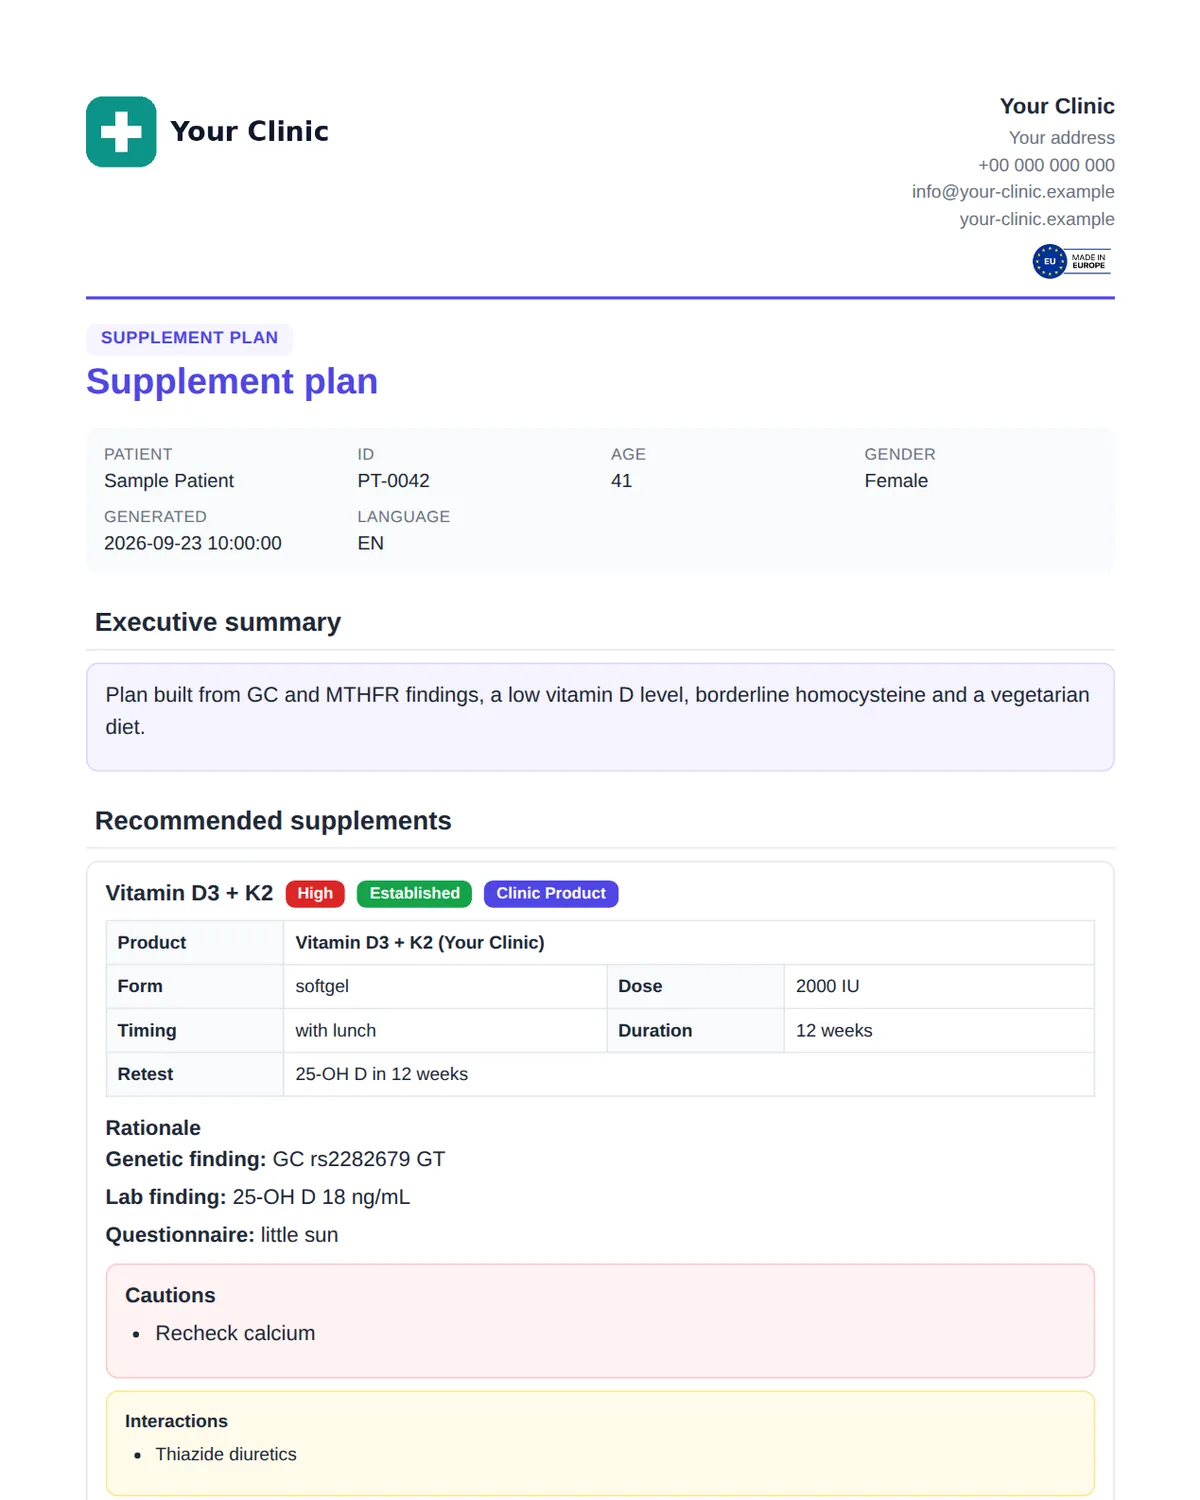
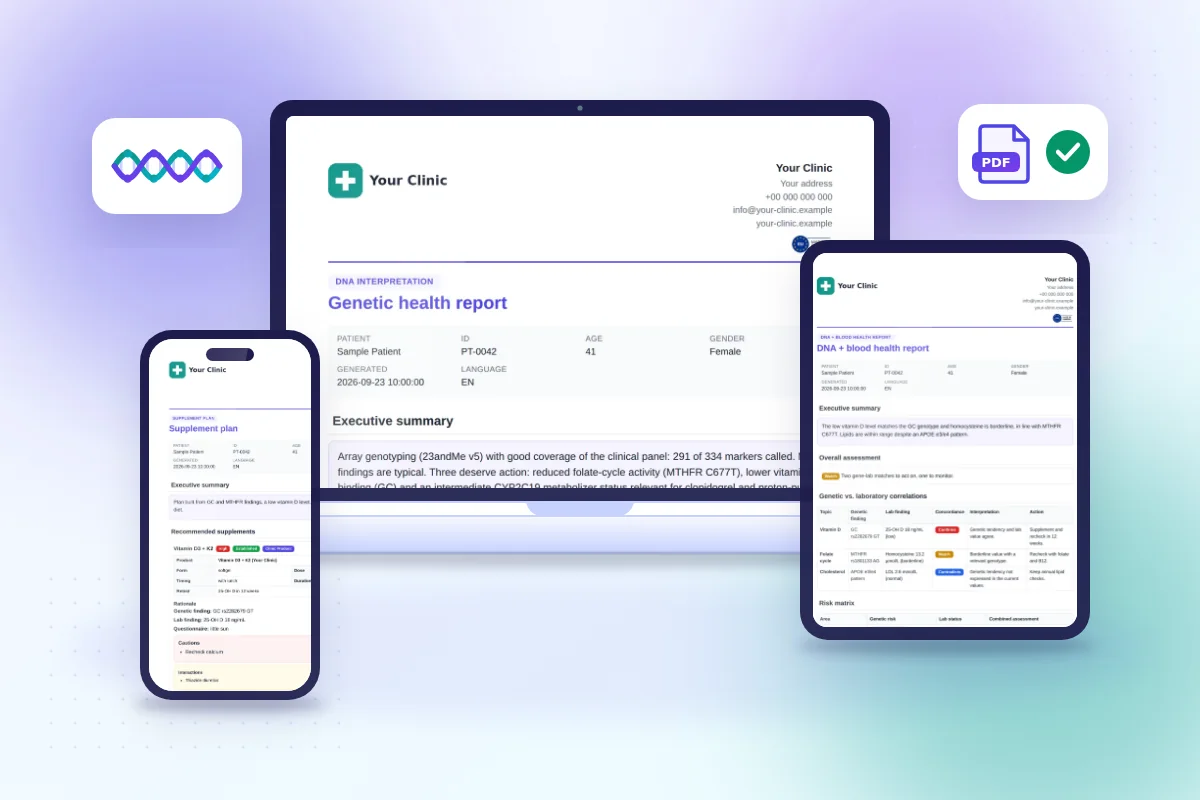
DNA test interpretation report open in the browser on a laptop, tablet and phone, with DNA, blood and supplement pages
The same report opens in the browser on laptop, tablet and phoneKantesti DNA reports open in the browser on any device and print as a print-quality A4 PDF with selectable text.
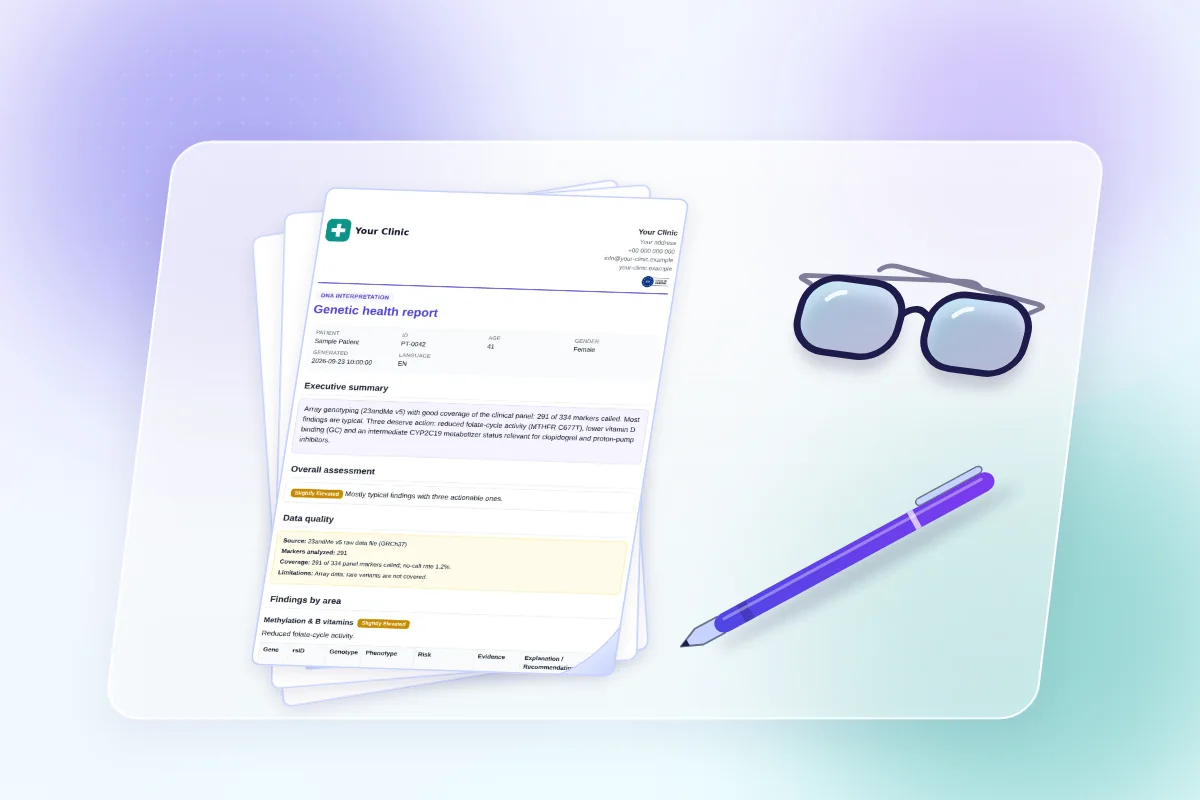
Printed A4 DNA test interpretation report on a desk beside a pen and reading glasses, with the clinic header on top
Every report prints as a print-quality A4 PDFEach DNA report prints as a print-quality A4 PDF with selectable text, from any device. The clinic's logo and contact details appear at the top.
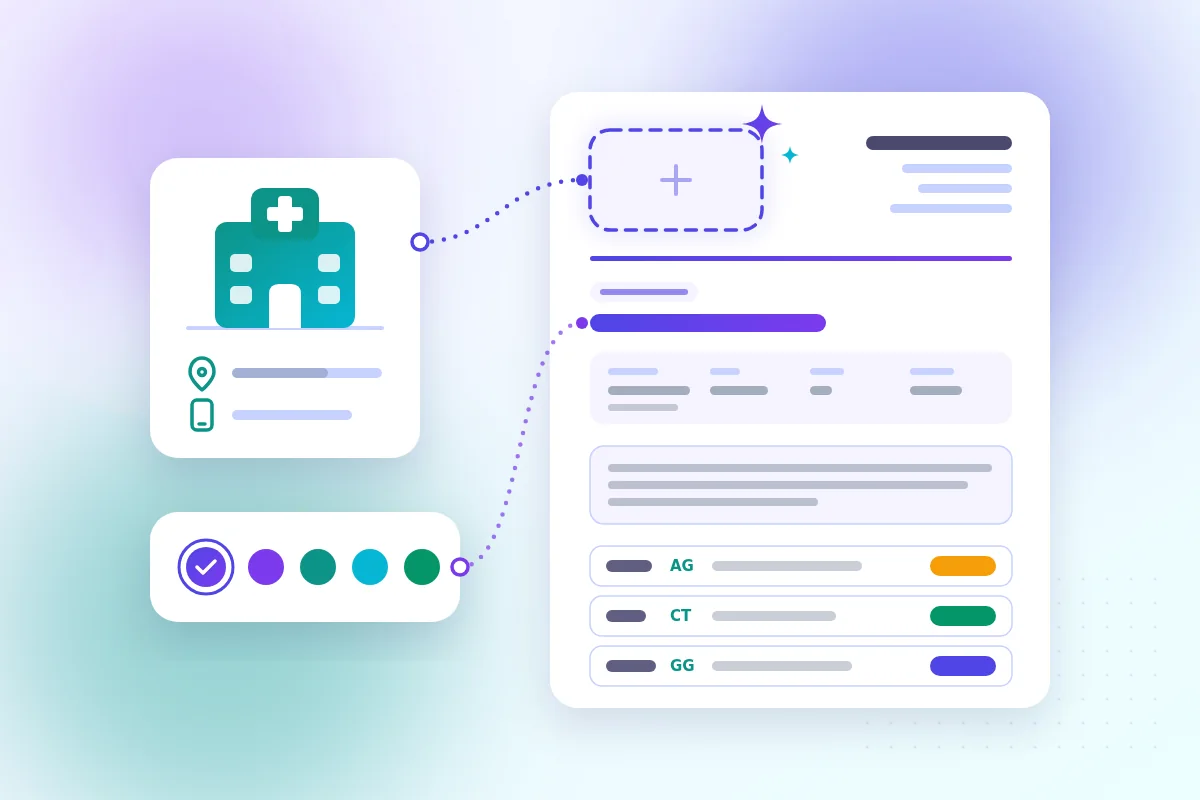
White-label DNA report: an empty logo slot in the header linked to a clinic building icon with its address and phone
Your clinic's logo and details on every reportReports are white-label: the clinic's logo, name, address and contact details appear on every DNA report.

In every report

  • Your clinic's logo, name, address and contact details.
  • Patient details, report date and language.
  • Colour-coded risk and evidence levels.
  • Limitations and a clear clinical disclaimer.
  • Print-quality A4 PDF on any device, with selectable text.

Try it with your own patients

We will set up the clinic panel and walk you through the three modules.