Data report Kantesti Ltd · UK
Kantesti Lab Insights: First half of 2026
What 386,742 anonymised blood test reports, analysed between 2026-01-01 and 2026-06-30, show.
- 386,742 reports
- 53 markers
- 162 countries
Medically reviewed on 2026-11-05
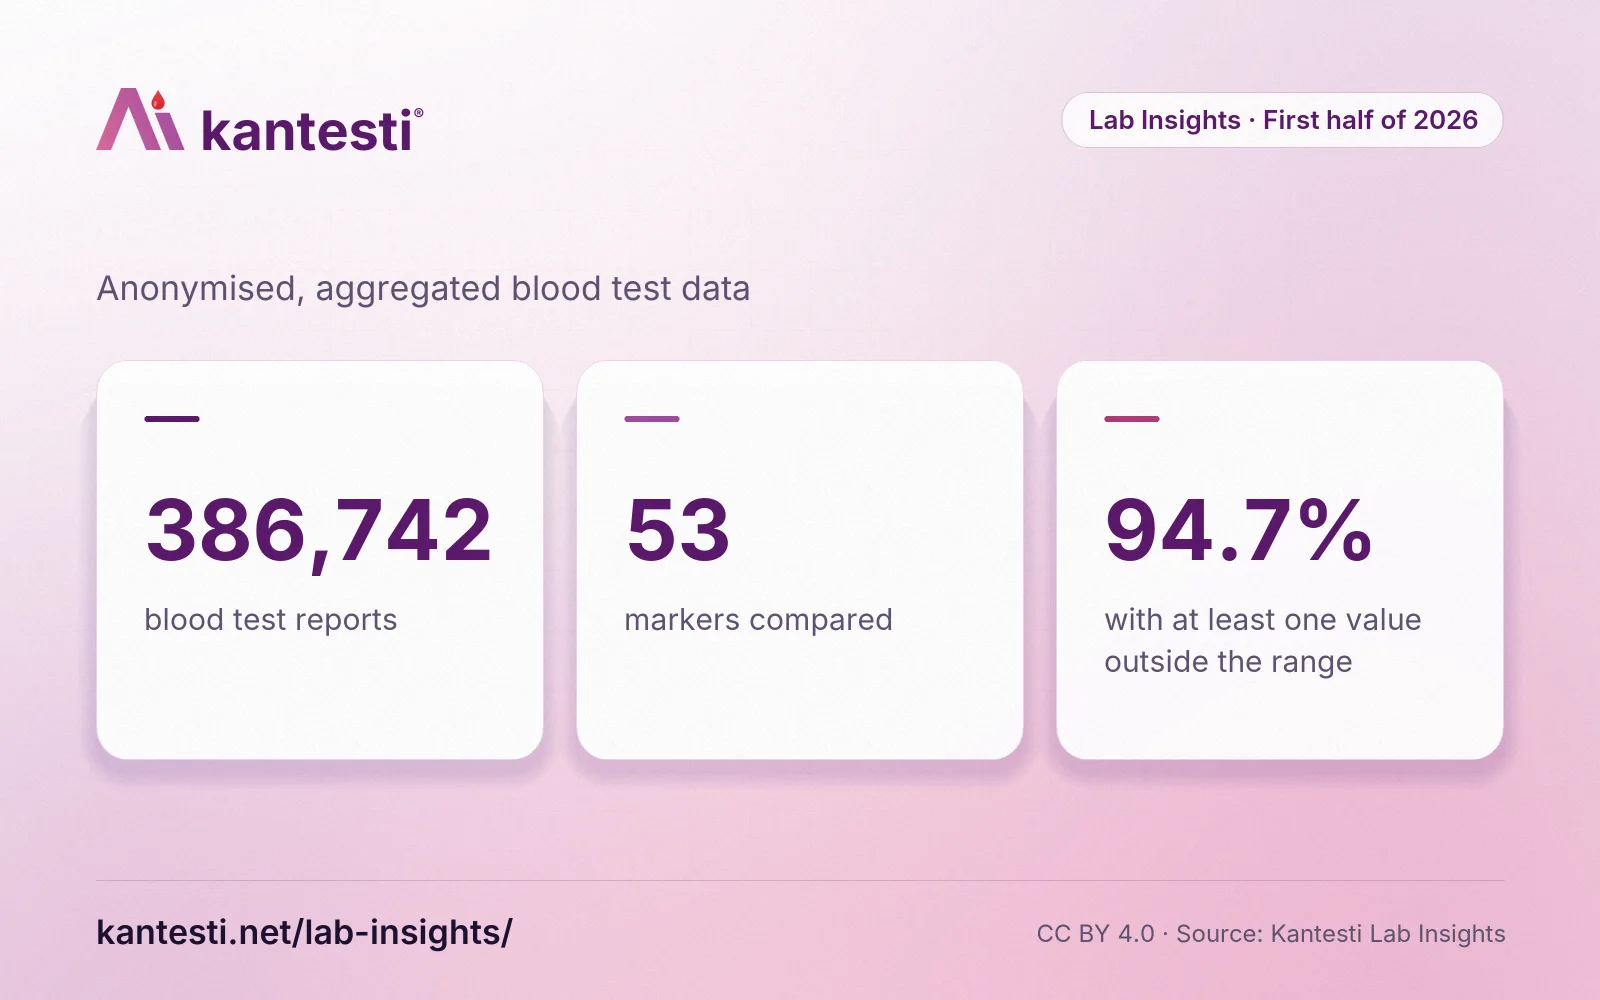
- 386,742 Reports analysed
- 53 Markers compared
- 162 Countries
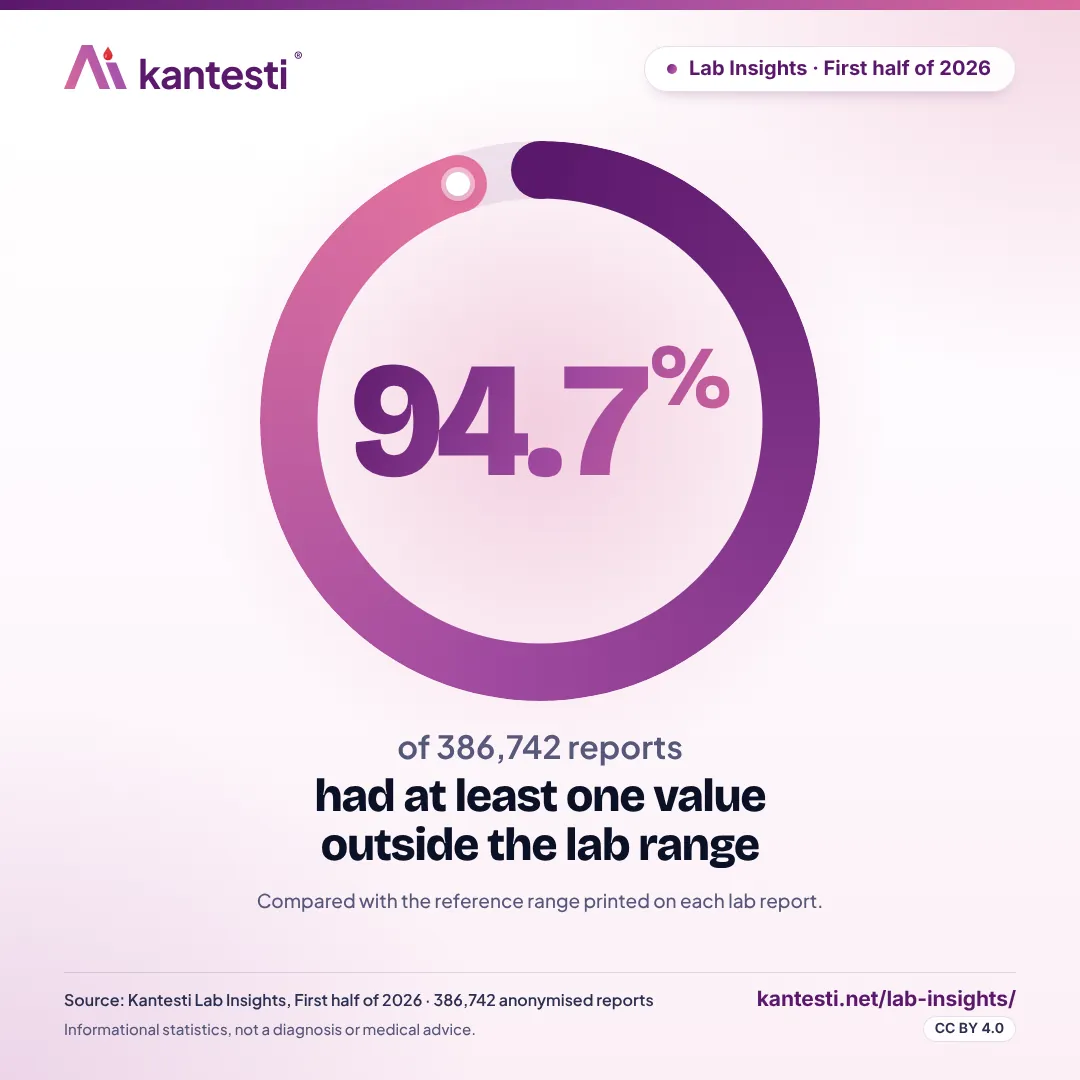
- 94.7% Reports with a value outside the lab range
- 83 Languages of the explanations
Key findings
What stands out
-
Most often outside the range
35.3% of the 146,126 reports that included Vitamin D (25-OH) were outside the lab range: 34.3% below it and 1.0% above it.
Vitamin D (25-OH) 25(OH)D
-
Second most often
33.0% of the 238,946 reports that included LDL cholesterol were outside the lab range: 1.0% below it and 32.0% above it.
LDL cholesterol LDL-C
-
Biggest difference between women and men
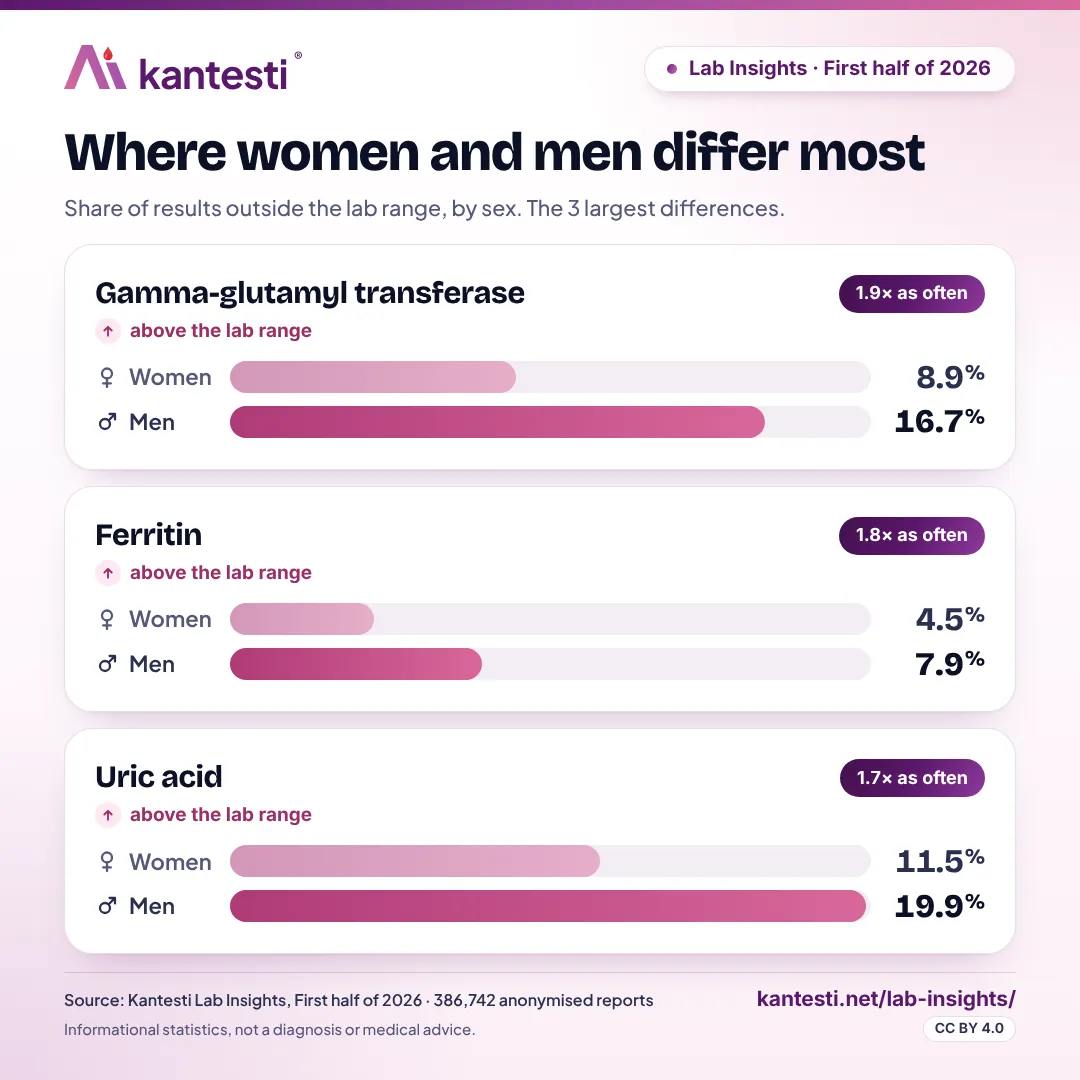
Gamma-glutamyl transferase: 16.7% of results from men were above the lab range, against 8.9% of results from women (1.9 times as often).
Gamma-glutamyl transferase GGT
-
Most common combination
17.0% of the 231,176 reports that included both LDL cholesterol and Total cholesterol had both values above the lab range.
LDL cholesterol LDL-C Total cholesterol TC
Ranking
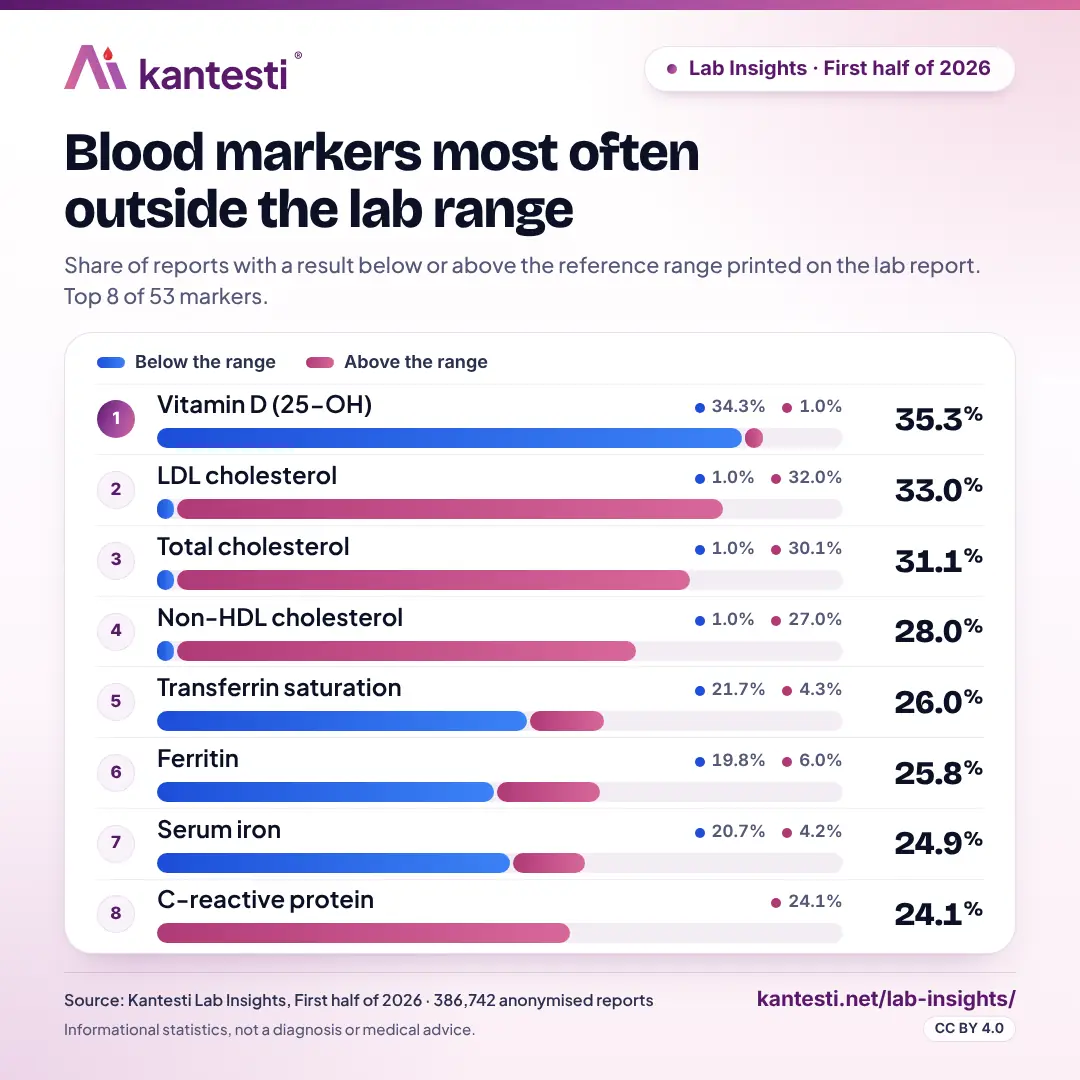
Results most often outside the lab range
The share of reports in which a result was below or above the reference range printed on the lab report. The 10 markers with the highest share, among markers with at least 500 reports.
- Below the range
- Above the range
- 1Vitamin D (25-OH) 25(OH)D 35.3%
- 2LDL cholesterol LDL-C 33.0%
- 3Total cholesterol TC 31.1%
- 4Non-HDL cholesterol non-HDL-C 28.0%
- 5Transferrin saturation TSAT 26.0%
- 6Ferritin FER 25.8%
- 7Serum iron Fe 24.9%
- 8C-reactive protein CRP 24.1%
- 9Triglycerides TG 22.2%
- 10High-sensitivity CRP hs-CRP 22.0%
| Marker | Reports tested | Below % | Above % | Outside % |
|---|---|---|---|---|
| Vitamin D (25-OH) | 146,126 | 34.3% | 1.0% | 35.3% |
| LDL cholesterol | 238,946 | 1.0% | 32.0% | 33.0% |
| Total cholesterol | 236,036 | 1.0% | 30.1% | 31.1% |
| Non-HDL cholesterol | 234,393 | 1.0% | 27.0% | 28.0% |
| Transferrin saturation | 120,342 | 21.7% | 4.3% | 26.0% |
| Ferritin | 115,217 | 19.8% | 6.0% | 25.8% |
| Serum iron | 116,302 | 20.7% | 4.2% | 24.9% |
| C-reactive protein | 116,079 | not reported | 24.1% | 24.1% |
| Triglycerides | 224,938 | 2.0% | 20.2% | 22.2% |
| High-sensitivity CRP | 52,517 | not reported | 22.0% | 22.0% |
— not reported, or fewer than 50 reports
By sex
Differences between women and men
Markers where the share outside the lab range differs most between women and men. In each pair of bars the group with the higher share comes first.
- Below the range
- Above the range
-
Gamma-glutamyl transferaseAbove the range1.9× as often
Men 16.7%Women 8.9% -
FerritinAbove the range1.8× as often
Men 7.9%Women 4.5% -
Uric acidAbove the range1.7× as often
Men 19.9%Women 11.5% -
Alanine aminotransferaseAbove the range1.6× as often
Men 17.9%Women 11.4% -
FerritinBelow the range1.6× as often
Women 23.6%Men 15.2%
| Marker | Direction | Women | Men | Ratio |
|---|---|---|---|---|
| Gamma-glutamyl transferase | Above the range | 8.9% | 16.7% | 1.9 |
| Ferritin | Above the range | 4.5% | 7.9% | 1.8 |
| Uric acid | Above the range | 11.5% | 19.9% | 1.7 |
| Alanine aminotransferase | Above the range | 11.4% | 17.9% | 1.6 |
| Ferritin | Below the range | 23.6% | 15.2% | 1.6 |
By age
Differences by age
Markers where the share outside the lab range differs most between the age bands. Each pair of bars shows the age band with the highest share and the one with the lowest.
- Below the range
- Above the range
-
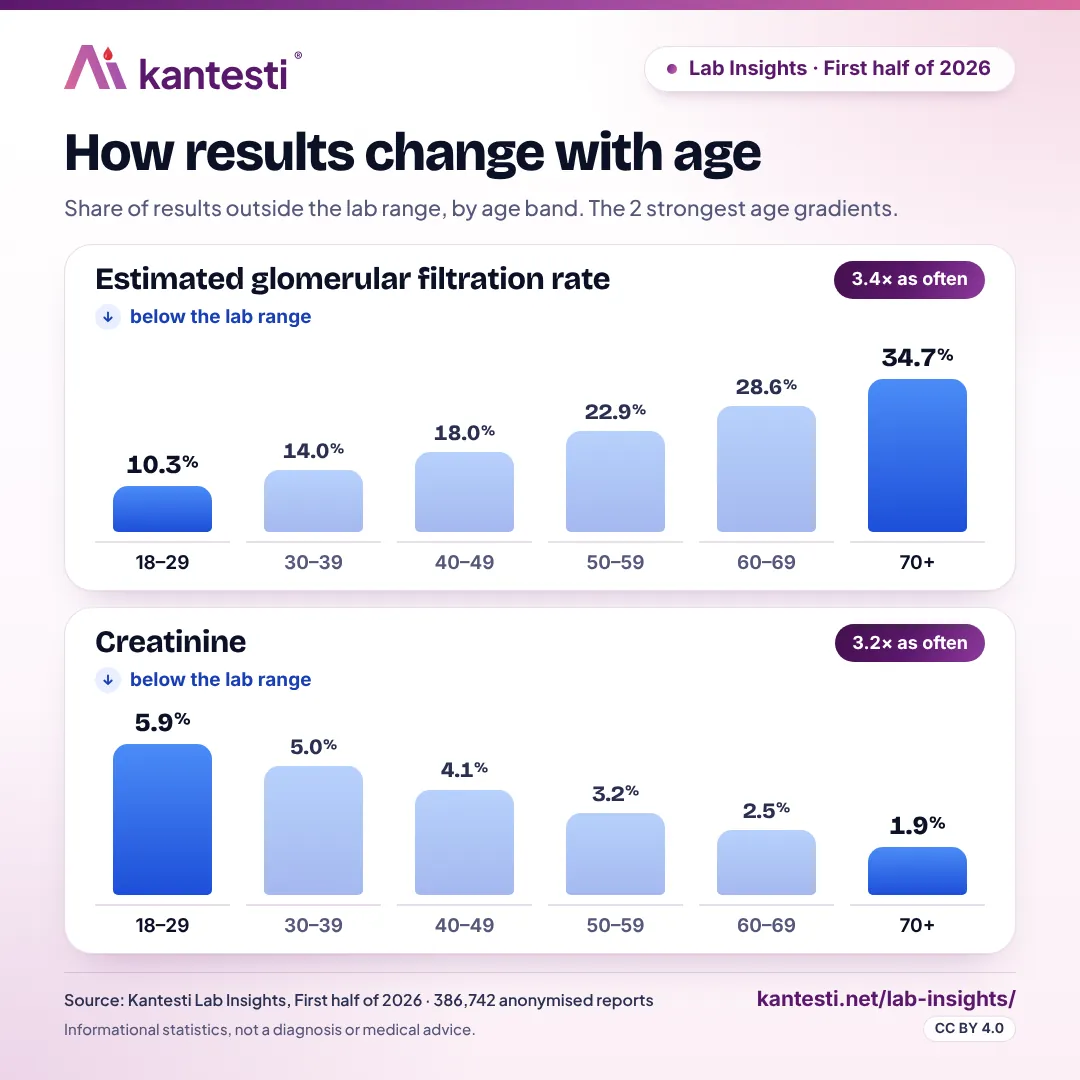
Estimated glomerular filtration rateBelow the range3.4× as often
70+ 34.7%18–29 10.3% -
CreatinineBelow the range3.2× as often
18–29 5.9%70+ 1.9% -
CreatinineAbove the range2.3× as often
70+ 16.3%18–29 7.1% -
Fasting glucoseAbove the range2.0× as often
70+ 28.1%18–29 14.0% -
HbA1cAbove the range1.9× as often
70+ 29.2%18–29 15.1%
| Marker | Direction | Highest age band | Lowest age band | Ratio |
|---|---|---|---|---|
| Estimated glomerular filtration rate | Below the range | 70+: 34.7% | 18–29: 10.3% | 3.4 |
| Creatinine | Below the range | 18–29: 5.9% | 70+: 1.9% | 3.2 |
| Creatinine | Above the range | 70+: 16.3% | 18–29: 7.1% | 2.3 |
| Fasting glucose | Above the range | 70+: 28.1% | 18–29: 14.0% | 2.0 |
| HbA1c | Above the range | 70+: 29.2% | 18–29: 15.1% | 1.9 |
Combinations
Results that often appear together
Among reports that include both results, the share in which both were outside the lab range, in the direction shown.
-
LDL cholesterol Total cholesterol
17.0% of the 231,176 reports with both results had LDL cholesterol above and Total cholesterol above the lab range.
-
LDL cholesterol Non-HDL cholesterol
15.7% of the 229,569 reports with both results had LDL cholesterol above and Non-HDL cholesterol above the lab range.
-
Serum iron Transferrin saturation
9.9% of the 112,510 reports with both results had Serum iron below and Transferrin saturation below the lab range.
-
Serum iron Ferritin
9.4% of the 107,693 reports with both results had Serum iron below and Ferritin below the lab range.
-
Fasting glucose HbA1c
9.3% of the 208,715 reports with both results had Fasting glucose above and HbA1c above the lab range.
Population
Who is in the data
Counts of reports, never of people. The shares below describe the reports in this edition.
Reports by sex
- Women 54.5%
- Men 45.5%
Reports by age band
- 18–29 15.8%
- 30–39 21.9%
- 40–49 22.4%
- 50–59 18.8%
- 60–69 13.7%
- 70+ 7.3%
Top countries
- Türkiye 11.2% (43,397)
- Germany 10.2% (39,367)
- Italy 6.7% (26,003)
- United States 6.2% (23,889)
- France 3.7% (14,345)
- Spain 3.3% (12,884)
- United Kingdom 3.1% (12,135)
- Brazil 2.8% (10,932)
- Romania 2.2% (8,336)
- Russia 2.1% (8,066)
Languages of the lab reports
The lab reports are written in 52 languages.
- EN 23.6%
- DE 12.0%
- TR 10.8%
- FR 7.3%
- IT 6.5%
Languages Kantesti wrote in
Explained in 83 languages.
- EN 23.4%
- DE 11.0%
- TR 9.9%
- FR 6.9%
- IT 6.1%
File types
- PDF 68.4%
- Photos 22.5%
- Screenshots 9.2%
Reports per month
- 61,595Jan
- 55,425Feb
- 65,572Mar
- 63,403Apr
- 69,367May
- 71,380Jun
Share and reuse
Infographics of the key findings
5 images with the numbers of this edition, ready to share. You may reuse them if you credit Kantesti (CC BY 4.0).
Method
How we made this report
What the numbers count, what they leave out and how to read them.
Period and scope
The figures cover lab reports analysed between 2026-01-01 and 2026-06-30.
Adults only
Only reports from adults are counted. Reports known to belong to people under 18 are left out.
Counts only
The data holds counts of lab reports. It holds no names, e-mail addresses, account numbers, birth dates, file names or single values.
Numbers below 50 are not shown
Numbers below 50 are not shown, so no one can be recognised from a small group.
The lab's own reference ranges
Below and above mean outside the reference range printed on each lab report. Ranges differ between laboratories, countries, ages and sexes, so a result outside a range is not a diagnosis.
Not population figures
People chose to upload their reports, so the figures describe those reports. They are not prevalence figures for any population.
Duplicates and test accounts
Duplicate reports and test or internal accounts are removed before counting.
Not medical advice
Informational statistics, not a diagnosis or medical advice. Talk to a doctor about your own results.
Open data
Data and citation
The full data of this edition is open. You may reuse it and the charts if you credit Kantesti.
One row per figure, UTF-8, percentages rounded to one decimal.
Licence: CC BY 4.0. Share and adapt with credit to Kantesti.
Press contact: [email protected]
How to cite
Kantesti Lab Insights, First half of 2026. Kantesti Ltd, 2026. https://www.kantesti.net/lab-insights/first-half-of-2026/
Summary card
People
Who made this report
Prepared by
-
 Julian Emirhan BulutCEO, medical researcher and AI engineer
Medical review: Kantesti Medical Team
-
 Thomas Klein, MDChief Medical Officer
-
 Sarah Mitchell, MD, PhDMedical team
-
 Prof. Dr. Hans Weber, PhDMedical team
Reviewed on 2026-11-05
Have a blood test report of your own?
Kantesti is an AI blood test analyzer that explains every value of your lab report in plain language.
Informational statistics, not a diagnosis or medical advice.