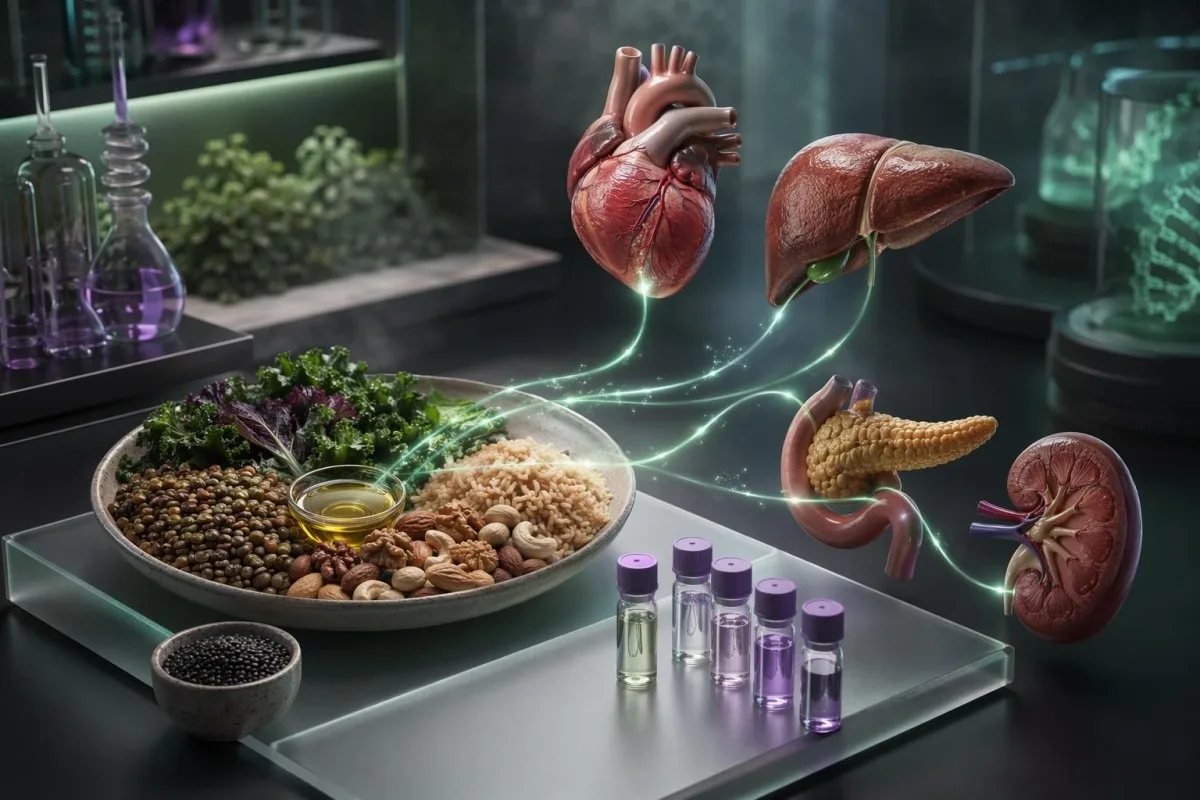
A Blue Zones-style plate can be brilliant for one metabolism and awkward for another. Your lab patterns can show whether more beans, grains, nuts and less animal food fit your current biology.


- ApoB below 80–90 mg/dL is a better sign than LDL-C alone that a higher-legume, lower-saturated-fat pattern is matching your cardiovascular risk goals.
- HbA1c of 5.7–6.4% is prediabetes; if your fasting insulin is also high, a generic high-grain longevity diet may need lower glycemic tailoring.
- Ferritin below 30 ng/mL strongly suggests depleted iron stores, even when hemoglobin is still normal.
- Vitamin B12 below 200 pg/mL is usually deficient, while 200–350 pg/mL can still be clinically suspicious if MMA or homocysteine is high.
- hs-CRP below 1 mg/L suggests lower vascular inflammatory risk; above 3 mg/L should prompt a search for infection, adiposity, gum disease or inflammatory illness.
- Triglycerides above 150 mg/dL after adopting more grains or fruit may mean your carbohydrate dose is exceeding your insulin sensitivity.
- eGFR below 60 mL/min/1.73 m² for 3 months changes how aggressively you should increase potassium-rich foods such as beans, potatoes and greens.
- TSH outside roughly 0.4–4.0 mIU/L can change how you tolerate soy, seaweed and iodine-rich anti-aging foods.
- Albumin below 3.5 g/dL is not a normal “plant-based” finding; it needs assessment for inflammation, liver, kidney, gut or protein intake problems.
Which blood tests tell you if the blue zones diet fits?
The blue zones diet fits you best when your labs show low ApoB or improving LDL-C, stable glucose, adequate iron/B12/vitamin D, normal kidney function, and no worsening triglycerides or liver enzymes. As of May 27, 2026, I would not copy a longevity meal plan blindly; I would first check whether your metabolism handles legumes, whole grains, nuts and lower animal protein safely.
In my clinical work, the patient who worries me is not the person eating more beans. It is the 48-year-old who replaces breakfast eggs with sweet granola, adds fruit juice “for antioxidants,” and returns 12 weeks later with triglycerides up from 92 to 214 mg/dL.
Kantesti is an AI blood test interpretation platform that reads a plant based diet blood test in context, not as isolated red and green flags. Our clinical team’s background is described on About Us, and I, Thomas Klein, MD, review these diet-lab patterns with the same question each time: what changed, and did the body like it?
The best trial evidence for Mediterranean-like plant-forward eating is not identical to Blue Zones eating, but it is relevant. In PREDIMED, Estruch et al. reported fewer major cardiovascular events with a Mediterranean diet supplemented with extra-virgin olive oil or nuts (Estruch et al., 2018), which is why I pay close attention to lipid and inflammation markers when patients adopt a longevity diet.
A sensible baseline includes a lipid panel with ApoB if possible, HbA1c, fasting glucose, fasting insulin, CBC, ferritin, B12, folate, vitamin D, CMP, eGFR, urine albumin-creatinine ratio, TSH and hs-CRP. For a broader aging-risk frame, our longevity biomarker guide explains why trends usually beat a single “normal” result.
How cholesterol markers reveal your response to plant-forward eating
ApoB, LDL-C, non-HDL cholesterol and triglycerides show whether a Blue Zones-style diet is improving or worsening heart-risk biology. LDL-C below 100 mg/dL is often acceptable for lower-risk adults, but ApoB below 80–90 mg/dL gives a cleaner view of atherogenic particle burden.
The 2018 AHA/ACC cholesterol guideline treats ApoB as a useful risk-enhancing marker, especially when triglycerides are at least 200 mg/dL (Grundy et al., 2019). A person can have LDL-C of 108 mg/dL and ApoB of 72 mg/dL, which is very different from LDL-C of 108 mg/dL and ApoB of 118 mg/dL.
I see two common patterns after people start a longevity diet. Pattern one is ideal: LDL-C falls 10–25%, ApoB drops, triglycerides stay below 100–120 mg/dL, and HDL-C does not collapse. Pattern two is mixed: LDL-C improves but triglycerides climb above 150 mg/dL because the person added too many refined grains, dried fruit or large starch portions.
ApoB is usually more informative than HDL-C “quality” claims, but HDL-related markers can still add texture. If your HDL-C is low and ApoB is high, our ApoA1 and ApoB guide explains how clinicians separate particle burden from cholesterol transport signals.
Do not judge the diet after 6 days. Lipid panels usually need 6–12 weeks after a stable diet change; testing after a holiday week or a sudden weight-loss phase can make triglycerides and LDL-C look stranger than they really are.
What glucose and insulin say about beans, grains and fruit
HbA1c, fasting glucose, fasting insulin and HOMA-IR show whether your body can handle the carbohydrate load of a Blue Zones-style plate. HbA1c below 5.7% is normal, 5.7–6.4% is prediabetes, and 6.5% or higher meets a diabetes threshold when confirmed.
The ADA diagnostic cutoffs remain practical in 2026: fasting glucose 100–125 mg/dL suggests prediabetes, while 126 mg/dL or higher on repeat testing suggests diabetes (American Diabetes Association Professional Practice Committee, 2024). A person with fasting glucose of 91 mg/dL but fasting insulin of 18 µIU/mL may already be compensating hard.
This is where Blue Zones advice gets misunderstood. Beans and oats are not the same as white bread, but a bowl of rice, dates and fruit after poor sleep can still push a 1-hour glucose above 180 mg/dL in an insulin-resistant person.
I like HOMA-IR as a rough early-warning tool, though cutoffs vary by population. Many clinicians become curious when HOMA-IR rises above about 2.0–2.5, and our HOMA-IR explainer walks through why fasting insulin can move before HbA1c does.
If HbA1c and fingerstick readings disagree, check CBC, ferritin, B12 and kidney function before blaming the diet. Iron deficiency can falsely raise HbA1c in some patients, while recent blood loss or high red-cell turnover can make HbA1c deceptively low.
Which nutrient labs matter before reducing animal foods?
Ferritin, B12, folate, vitamin D, zinc and CBC indices matter before you reduce meat, fish, eggs or dairy. Ferritin below 30 ng/mL usually means iron stores are depleted, even if hemoglobin is still within range.
A plant based diet blood test should not stop at cholesterol and glucose. I have seen runners with hemoglobin of 13.1 g/dL, ferritin of 9 ng/mL, normal MCV, and a diet history proudly full of lentils but nearly absent in heme iron.
Vitamin B12 below 200 pg/mL is generally deficient, and 200–350 pg/mL can still be suspicious when methylmalonic acid is above about 0.40 µmol/L or homocysteine exceeds 15 µmol/L. The quiet symptoms — numb toes, poor balance, low mood — do not always wait for anemia.
Folate tends to improve with leafy greens and legumes, but high folate can hide B12 problems on a CBC. Patients moving toward vegan or near-vegan eating should read our vegan lab checklist before assuming “plant-based” automatically means nutritionally complete.
Vitamin D is not a Blue Zones food problem; it is a latitude, skin exposure, supplement and absorption problem. A 25-OH vitamin D below 20 ng/mL is deficient by many guidelines, while 30–50 ng/mL is a common practical target for patients with bone, immune or muscle concerns.
Do protein and kidney markers support a lower-meat diet?
Albumin, creatinine, eGFR, BUN and urine albumin-creatinine ratio help decide whether a lower-meat Blue Zones pattern is safe and sufficient. Albumin should usually stay around 3.5–5.0 g/dL; low albumin is not a normal price of longevity eating.
Older adults are where generic advice can go sideways. A 72-year-old who swaps fish and yogurt for salad and fruit may lose 3 kg of muscle before albumin falls, because albumin is also shaped by inflammation, liver function and hydration.
BUN is often lower on plant-forward diets, but a BUN of 5 mg/dL with low creatinine, weight loss and fatigue makes me ask about protein intake and total calories. If you want age-specific guidance, our protein requirements guide gives practical warning signs beyond gym culture.
Kidney function changes the potassium and protein conversation. eGFR below 60 mL/min/1.73 m² for at least 3 months suggests chronic kidney disease, and urine ACR above 30 mg/g can show early kidney stress even when creatinine looks normal.
For most healthy adults, beans, tofu, lentils, nuts and occasional fish can meet protein needs. The trick is not “more protein forever”; it is enough leucine-rich protein per meal, stable strength, stable creatinine context, and no hidden albumin leak in the urine.
When liver enzymes and uric acid argue against a generic plan
ALT, AST, GGT, triglycerides and uric acid reveal whether a high-fruit, high-grain version of the blue zones diet is overloading the liver. ALT above roughly 35 IU/L in women or 45 IU/L in men often deserves context, especially with abdominal weight gain.
The Blue Zones idea is not a license for unlimited bread, honey and fruit. I have seen ALT fall from 68 to 31 IU/L when a patient kept beans but cut fruit smoothies, late-night rice bowls and sweetened “health” snacks.
GGT is a useful mischief marker. A GGT above 60 IU/L in adult men or above 40 IU/L in adult women often pushes me to review alcohol, fatty liver, bile duct issues, medications and triglyceride-rich carbohydrate patterns.
Uric acid above 6.8 mg/dL is above the approximate saturation point for monosodium urate crystals. If your Blue Zones plan includes large fructose loads or frequent juices, our fatty liver diet guide pairs well with uric acid and triglyceride tracking.
AST can rise after exercise, so do not blame tofu for an AST of 89 IU/L the morning after hill sprints. Recheck AST, ALT, CK and GGT after 3–7 quiet training days before making a diet verdict.
What inflammatory biomarkers add to longevity diet decisions
hs-CRP, ESR, ferritin, neutrophil-to-lymphocyte ratio and omega-3 status can show whether a longevity diet is lowering inflammatory load. hs-CRP below 1 mg/L is generally lower vascular risk, 1–3 mg/L is intermediate, and above 3 mg/L is higher risk if persistent.
Kantesti is an AI biomarker interpretation platform that compares inflammatory markers with CBC, liver enzymes, ferritin and symptoms, because hs-CRP alone is noisy. A cold, dental infection or hard workout can push CRP above 10 mg/L without saying anything useful about olive oil or legumes.
The pattern I trust is directional. If hs-CRP falls from 4.2 to 1.1 mg/L over 12 weeks while triglycerides, waist size and ALT improve, the diet is probably helping systemic risk.
If hs-CRP stays high while ferritin is high and transferrin saturation is normal, I think more about inflammation, fatty liver, autoimmune disease or chronic infection than iron overload. Our inflammaging marker guide explains why these slow, boring trends matter more than any single anti-aging food.
Omega-3 index can be helpful when fish intake is low. Many labs consider an omega-3 index above 8% desirable for cardiovascular risk context, though the evidence is stronger for risk association than for every supplement claim.
How thyroid, iodine and selenium labs change the food list
TSH, free T4, thyroid antibodies, urinary iodine and selenium status can change how you use soy, seaweed and cruciferous vegetables. TSH is commonly interpreted around 0.4–4.0 mIU/L, but age, pregnancy, medication timing and antibodies reframe that number.
Seaweed is where “natural” can become a dosing problem. Some dried kelp portions contain several thousand micrograms of iodine, far above the adult recommended intake of 150 µg/day and even above the usual upper limit of 1,100 µg/day.
Soy is not forbidden for most people with normal thyroid function. The practical issue is timing: soy fibre, calcium, iron and coffee can all interfere with levothyroxine absorption if taken too close to the dose.
Urinary iodine is best interpreted at a population level, but an individual very low or very high result can still be a clue. Our urinary iodine guide explains why spot urine values swing and why repeated context matters.
If TPO antibodies are positive, I am gentler with dramatic diet shifts. A patient with Hashimoto’s, ferritin of 14 ng/mL and vitamin D of 17 ng/mL needs correction of deficiencies as much as a beautiful plate of greens.
Why electrolytes and blood pressure medication matter
Potassium, sodium, bicarbonate, creatinine and eGFR determine whether high-potassium Blue Zones foods are safe. Potassium normally sits around 3.5–5.0 mmol/L, and levels above 5.5 mmol/L need timely review, especially with kidney disease or ACE inhibitor use.
Beans, potatoes, tomatoes and leafy greens can be excellent for blood pressure. They can also be too potassium-dense for someone with eGFR of 38 mL/min/1.73 m² taking lisinopril and spironolactone.
Sodium below 135 mmol/L is hyponatremia, and it deserves more nuance than “eat more salt.” Low sodium can come from thiazide diuretics, heart failure, adrenal disease, excess water intake or SIADH, and diet advice differs in each case.
A bicarbonate or CO2 below 22 mmol/L can suggest metabolic acidosis in kidney disease, which may worsen muscle breakdown and bone buffering. If you are raising plant foods for blood pressure, our potassium food guide is worth reading before adding daily green juices.
The safest strategy is boring: test electrolytes 1–3 weeks after major diet or medication changes if you have kidney disease, heart failure, diabetes, or blood pressure medication changes. Normal last year is reassuring, not a lifetime warranty.
What gut and absorption clues can reveal before you switch
CBC, ferritin, B12, folate, albumin, total protein and celiac antibodies can show whether your gut will absorb a plant-heavy diet well. Low ferritin plus low B12 plus low vitamin D is not a character flaw; it is an absorption pattern until proven otherwise.
A patient with bloating may blame beans, but the lab clue might be celiac disease, low pancreatic enzymes, inflammatory bowel disease or chronic gastritis. tTG-IgA should be interpreted with total IgA, because IgA deficiency can make a negative celiac screen misleading.
Albumin below 3.5 g/dL with low total protein can point to poor intake, liver disease, kidney loss, inflammation or gut protein loss. It is not enough to tell someone to add quinoa.
If MCV is high, B12 or folate problems move up the list; if RDW is high with normal MCV, early mixed deficiency is possible. Our celiac blood test guide explains when gluten must remain in the diet before testing, which many patients accidentally miss.
Gut symptoms after legumes often improve with slow titration: 2–3 tablespoons daily, pressure-cooked lentils, rinsed canned beans, and attention to onion or garlic FODMAPs. If diarrhea, weight loss or anemia appears, stop self-experimenting and get assessed.
Which medications and life stages change the interpretation?
Statins, metformin, GLP-1 medicines, diuretics, anticoagulants, pregnancy and older age change how Blue Zones-style labs should be read. A lab change that looks diet-related may actually be medication timing, weight loss speed or altered absorption.
Metformin can lower B12 over time, so a new plant-forward diet may get blamed for numbness that was brewing for years. I usually check B12 every 1–2 years in long-term metformin users, sooner if anemia or neuropathy appears.
Statins lower LDL-C and ApoB, so a “perfect” lipid response after diet change may be shared credit. The more useful question is whether triglycerides, glucose, liver enzymes and muscle symptoms changed after the food pattern changed.
Warfarin users should not avoid greens; they should keep vitamin K intake consistent and monitor INR. Our medication monitoring guide explains why consistency beats sudden restriction for several common drugs.
Pregnancy, breastfeeding, heavy endurance training and frailty all raise the stakes. A generic longevity diet written for a healthy 55-year-old office worker is not automatically right for a postpartum runner with ferritin of 8 ng/mL.
When should you test before and after changing diet?
Test before changing diet, then retest key markers after 8–12 weeks once the pattern is stable. Lipids, triglycerides, fasting insulin, liver enzymes and hs-CRP can move within weeks; ferritin, B12 and vitamin D often need months.
Kantesti AI compares serial lab reports so the slope matters, not just the red flag. A triglyceride rise from 70 to 138 mg/dL is still “normal,” but it may be meaningful if it occurred after a big increase in rice, bread or dried fruit.
For a clean baseline, keep exercise, alcohol, supplements and fasting duration ordinary for you. Testing after a marathon, viral illness or 36-hour fast can distort AST, CK, glucose, bilirubin, uric acid and white cell counts.
Our clinical standards for trend interpretation are described in Medical Validation, including why our system treats unit changes and lab-specific reference ranges carefully. For practical timing, our diet retest timeline gives the usual windows for cholesterol, A1c and nutrient markers.
My usual retest schedule is simple: lipids and CMP at 8–12 weeks, HbA1c at 12 weeks, ferritin/B12/vitamin D at 3–4 months, and urine ACR yearly if diabetes, hypertension or kidney risk is present.
Green, yellow and red lab patterns before you copy the plan
Green patterns include falling ApoB, triglycerides below 150 mg/dL, HbA1c below 5.7%, ferritin above 30 ng/mL, B12 sufficiency and stable eGFR. Red patterns include LDL-C at least 190 mg/dL, potassium above 5.5 mmol/L, unexplained anemia, or diabetes-range glucose.
Yellow patterns are the most common in real life. ApoB of 104 mg/dL, HbA1c of 5.8%, ferritin of 24 ng/mL and vitamin D of 19 ng/mL do not ban a Blue Zones diet; they tell you to personalize it.
Kantesti is an AI-powered blood test analysis tool used by 2M+ people across 127 countries, and this is exactly the kind of pattern our neural network is built to sort. It can compare a low ferritin trend with MCV, RDW, iron saturation and symptoms rather than giving one generic diet label.
A practical green plate for many people is half non-starchy plants, a quarter legumes or intact whole grains, and a quarter protein-dense food such as tofu, fish, eggs, yogurt or extra legumes depending on values and preferences. Our biomarker guide gives reference context across thousands of markers, while personal baseline tracking explains why your “normal” may be more useful than the lab average.
The red-flag exception is urgent physiology. Potassium of 6.1 mmol/L, glucose of 312 mg/dL, hemoglobin of 8.7 g/dL, or ALT 10 times the upper limit is not a meal-plan problem; it is a medical assessment problem.
My physician bottom line on longevity diets and labs
A Blue Zones-style diet is a strong starting template, not a metabolic identity. If your labs show improving ApoB, stable glucose, adequate nutrients, normal kidney safety and lower inflammation after 8–12 weeks, the plan probably fits; if not, adjust the plate before blaming yourself.
Thomas Klein, MD, my name on this piece, is less interested in dietary purity than in biological response. I have seen patients thrive on beans and barley, and I have seen others need fewer grains, more fish, iron repletion or medication review.
Kantesti’s medical reviewers and advisors are listed on our Medical Advisory Board, because YMYL diet advice should not float away from clinical accountability. We also publish technical validation work, including our clinical benchmark, so readers can see how interpretation quality is tested.
The safest version of a longevity diet is measurable. Check before, change one major thing at a time, retest on a realistic timeline, and ask whether the numbers moved in the direction your health goals require.
If you remember only one thing, remember this: anti-aging foods are not magic objects. They are inputs into your liver, muscles, kidneys, gut, immune system and arteries — and your blood tests are the receipt.
Frequently Asked Questions
What blood tests should I check before starting a blue zones diet?
Before starting a blue zones diet, check a lipid panel with ApoB if available, HbA1c, fasting glucose, fasting insulin, CBC, ferritin, B12, folate, vitamin D, CMP, eGFR, urine albumin-creatinine ratio, TSH and hs-CRP. These markers cover cholesterol response, glucose control, nutrient reserves, kidney safety, liver enzymes and inflammation. If you have diabetes, kidney disease, thyroid disease or take blood pressure medicines, potassium and creatinine deserve extra attention within 1–3 weeks of major dietary changes.
Can the blue zones diet raise triglycerides?
Yes, a Blue Zones-style diet can raise triglycerides if the person adds too much refined starch, dried fruit, juice, sweetened foods or large grain portions for their insulin sensitivity. Triglycerides below 150 mg/dL are considered normal, but a rise from 80 to 145 mg/dL after diet change can still be clinically meaningful. If triglycerides exceed 150–200 mg/dL, review carbohydrate quality, alcohol intake, thyroid status, glucose control and recent weight change.
Is a plant based diet blood test different from a normal blood test?
A plant based diet blood test is usually a standard set of labs interpreted through the lens of lower animal-food intake. The most useful additions are ferritin, B12, methylmalonic acid when B12 is borderline, vitamin D, zinc if symptoms suggest deficiency, CBC indices, lipid markers and kidney function. Ferritin below 30 ng/mL or B12 below 200 pg/mL should not be dismissed as normal adaptation to plant-based eating.
What cholesterol result means the longevity diet is working?
A longevity diet is more likely helping cardiovascular risk when ApoB falls below about 80–90 mg/dL, LDL-C decreases, non-HDL cholesterol improves, and triglycerides stay below 150 mg/dL. LDL-C alone can mislead because two people with the same LDL-C may have different ApoB particle counts. If LDL-C is 190 mg/dL or higher, clinician review is needed even if the diet is otherwise excellent.
How long after changing diet should I repeat blood tests?
Repeat lipids, CMP, triglycerides and fasting insulin after about 8–12 weeks of a stable diet change. HbA1c usually needs around 12 weeks because it reflects red-cell glucose exposure over time, while ferritin, B12 and vitamin D often need 3–4 months to show a reliable shift. Testing immediately after illness, heavy exercise, fasting or travel can distort liver enzymes, glucose, uric acid, bilirubin and CBC results.
Who should not copy a generic blue zones diet without medical advice?
People with diabetes-range glucose, eGFR below 60 mL/min/1.73 m², potassium above 5.0–5.5 mmol/L, unexplained anemia, LDL-C at least 190 mg/dL, active eating disorders, pregnancy, frailty or complex medication use should not copy a generic Blue Zones diet without medical advice. The issue is not that plant-forward eating is unsafe; it is that the dose of carbohydrate, potassium, fibre, protein or vitamin K may need individual adjustment. A clinician can match the diet to medications, kidney function and nutritional status.
Can I eat leafy greens on a Blue Zones-style diet if I take warfarin?
Yes—keep your vitamin K intake consistent rather than avoiding greens, and tell the clinician managing your warfarin before making major diet changes. More frequent INR checks may be needed while your usual portions of spinach, kale, or other greens change.
How can I make legumes less likely to cause gas when starting this diet?
Start with a ¼-cup serving of canned, well-rinsed lentils or beans every other day, then increase over 2–4 weeks while drinking adequate fluids. Seek medical advice rather than pushing through severe pain, weight loss, persistent diarrhea, or blood in the stool.
Should I change my supplements when I move toward a Blue Zones-style diet?
Sometimes. If animal foods drop to only occasional use, ask about vitamin B12, vitamin D, iron, calcium, iodine, and omega-3 needs; the right choice depends on your labs, menstrual status, pregnancy plans, thyroid disease, and kidney function.
Get AI-Powered Blood Test Analysis Today
Join over 2 million users worldwide who trust Kantesti for instant, accurate lab test analysis. Upload your blood test results and receive comprehensive interpretation of 15,000+ biomarkers in seconds.
📚 Referenced Research Publications
Klein, T., Mitchell, S., & Weber, H. (2026). BUN/Creatinine Ratio Explained: Kidney Function Test Guide. Kantesti AI Medical Research.
Klein, T., Mitchell, S., & Weber, H. (2026). Urobilinogen in Urine Test: Complete Urinalysis Guide 2026. Kantesti AI Medical Research.
📖 External Medical References
⚕️ Medical Disclaimer
This article is for educational purposes only and does not constitute medical advice. Always consult a qualified healthcare provider for diagnosis and treatment decisions.
E-E-A-T Trust Signals
Experience
Physician-led clinical review of lab interpretation workflows.
Expertise
Laboratory medicine focus on how biomarkers behave in clinical context.
Authoritativeness
Written by Dr. Thomas Klein with review by Dr. Sarah Mitchell and Prof. Dr. Hans Weber.
Trustworthiness
Evidence-based interpretation with clear follow-up pathways to reduce alarm.