

LONDON, 29 September 2026 — Kantesti Ltd, the UK-registered health technology company, announced Body Map and Biological Blood Age in London on 29 September 2026, with matching developer APIs, for individuals reading their own laboratory results, partner clinics and developers.

The announcement follows deployment in reports and APIs
The public announcement follows the deployment of both report features and the release of their stand-alone APIs. Body Map has appeared in reports since 14 September 2026; the blood age estimate and hidden indices followed on 15 September 2026.
The two APIs shipped on 18 September 2026 alongside Blood Test Analysis v12. The report features serve people reading their own results and partner clinics, while the APIs make the corresponding mapping and calculation functions available to developers.
The additions arrange laboratory information by body region and present an estimated age alongside calendar age. The map groups flagged values by their commonly associated organs or body systems, while the age presentation identifies the markers that shaped the estimate and adds calculated indices that many laboratory reports leave out.
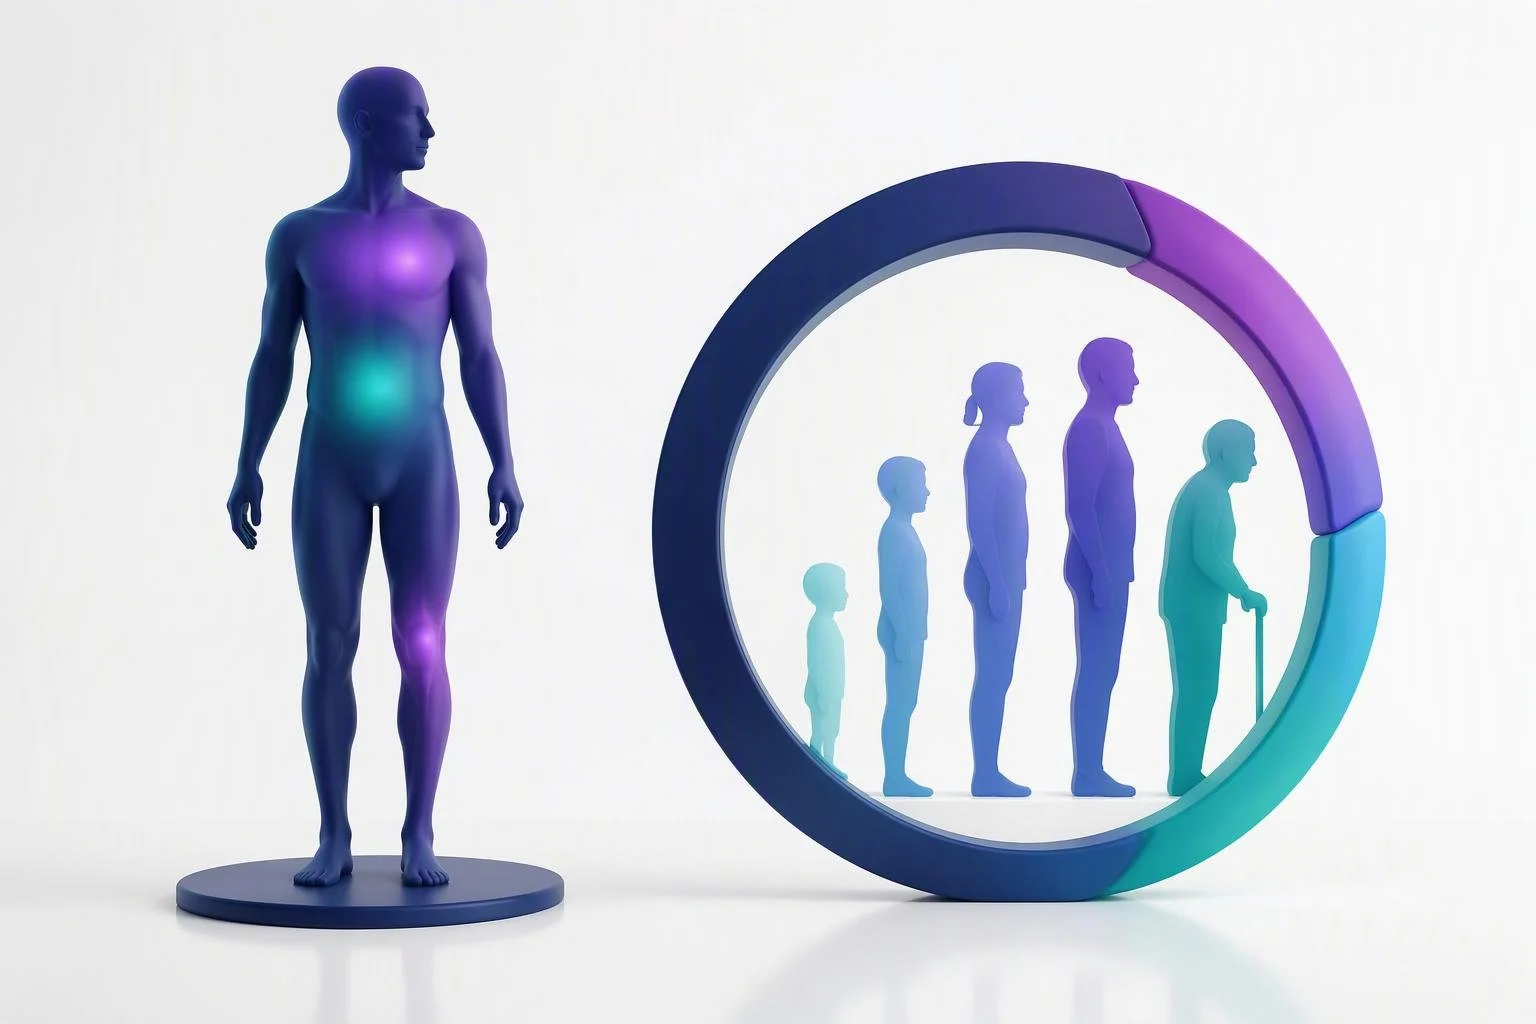
“People read a lab report as a list of numbers, but they think about their health as a body and a lifetime. Body Map shows where each flagged result points, Biological Blood Age shows what the whole panel adds up to, and the hidden indices bring out what the printout leaves unsaid. It is the same report, arranged the way people understand it, and clear that it is not a diagnosis.”
Body Map groups flagged results across 13 regions
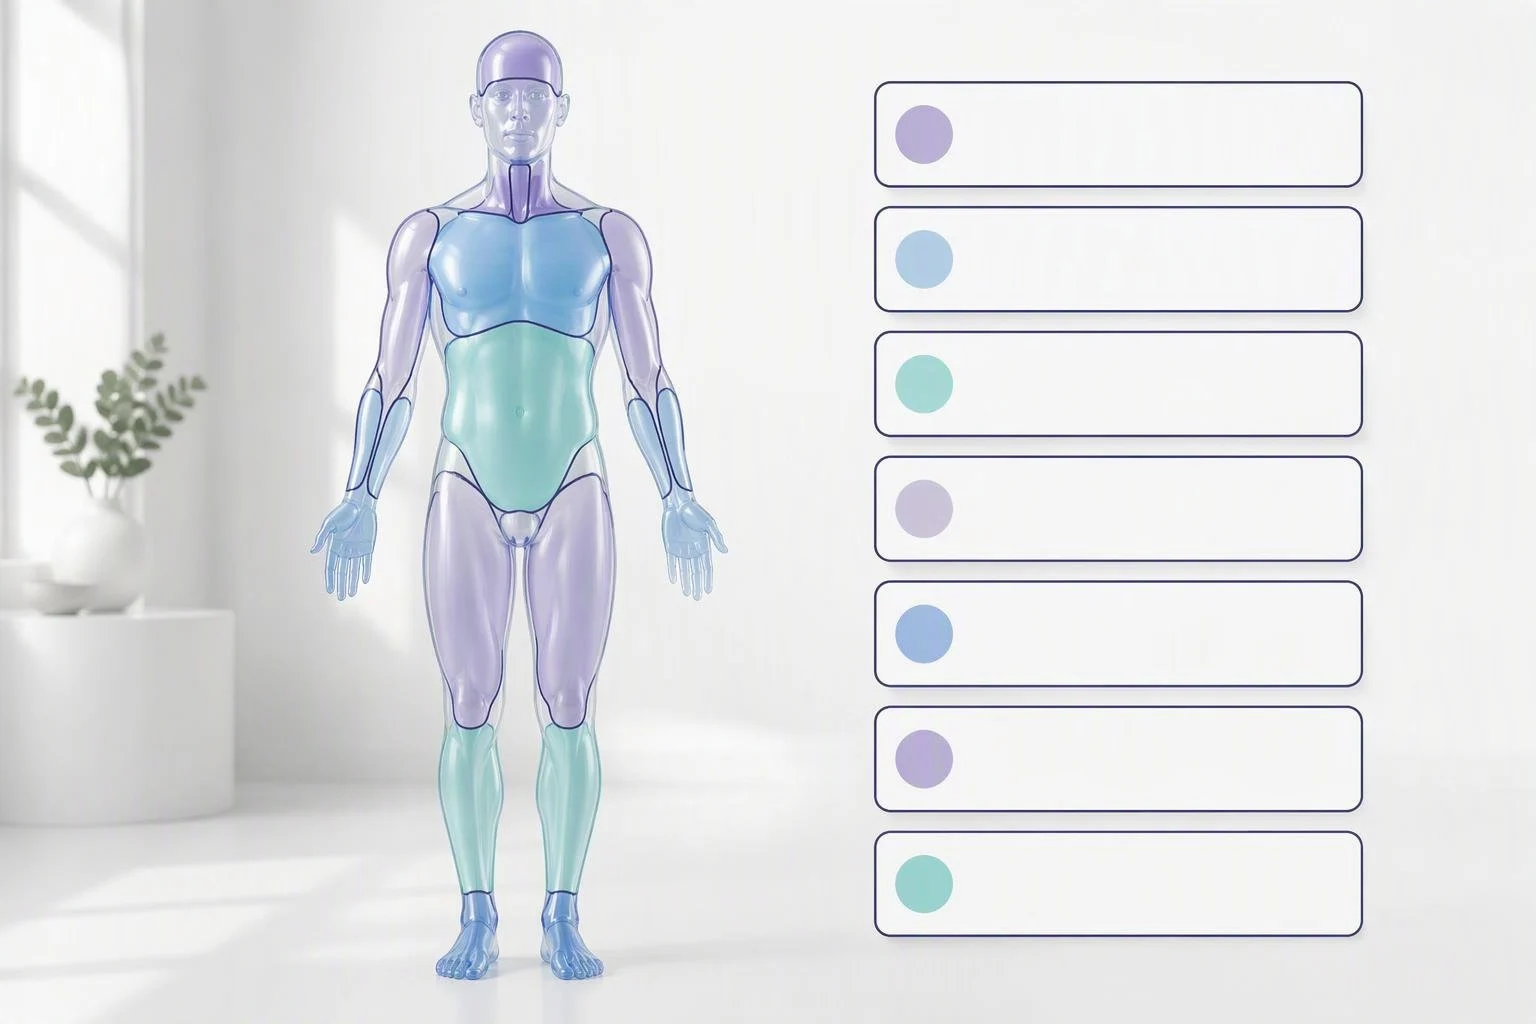
Body Map compares every value with the reference range printed on the patient's own laboratory report, including its unit. It places values outside that range on a human silhouette and labels the organ or system commonly associated with each marker, turning laboratory-order listings into a body-region view.
The accompanying legend groups markers by region and retains each marker's name, result and unit exactly as the laboratory printed them. It separates borderline values, classified as slightly high or low at level 1, from high, low or abnormal values at level 2; values within range are level 0 and do not appear on the map.
The regions cover brain and nerves, thyroid, heart and blood vessels, liver, pancreas and blood sugar, adrenal glands, kidneys and electrolytes, gut and digestion, reproductive system, blood, immune system, bones and minerals, and muscles. Highlighted areas indicate a marker's association with a region, not a diagnosis or evidence of disease in that organ.
Blood age: report estimates and API calculations
In reports, the Kantesti AI engine estimates blood age using every value in the panel and the age entered by the patient. It displays the estimate alongside calendar age, names the contributing markers and provides a plain-language explanation; panels containing fewer markers produce a more approximate number.
The API instead uses the published Levine PhenoAge formula by default, with calendar age from 18 to 100 and these routine markers: albumin, creatinine, glucose, CRP, lymphocytes, MCV, RDW, ALP and WBC. Its deterministic calculation uses population-median imputation, makes no network call, incurs no extra cost and produces identical output for identical input.
Optional AI assistance is available through ai_assist, ai_estimate or ai_note, but the model never overrides a complete nine-marker PhenoAge calculation. Derived indices use published formulas and can include non-HDL cholesterol, total/HDL cholesterol ratio, estimated average glucose, TG/HDL ratio, atherogenic index of plasma, remnant cholesterol and eGFR (CKD-EPI 2021).
Developer endpoints return mapping and calculation outputs
The v1 Body Map endpoint, POST /api/v1/body-map/analyze, returns a language-free legend and an illustration URL. The legend contains region keys and laboratory-printed analyte names, while the illustration contains no text, allowing integration into interfaces in different languages; the call waits up to 30 seconds for the illustration.
The v1 blood age endpoint, POST /api/v1/blood-age/analyze, returns the age calculation and up to 18 derived clinical indices per panel. Each analysis endpoint accepts up to 500 blood test parameters and costs 1 credit, with free POST /api/v1/{body-map,blood-age}/sandbox and POST /api/v1/{body-map,blood-age}/validate endpoints.
Requests authenticate with an API username and password supplied in a JSON body, form body or HTTP Basic, and credentials are checked on every call. Documentation appears in 12 languages at kantesti.net/docs; the Kantesti APIs support 100 languages, distinct from the platform's 39 interface languages.
Educational safeguards accompany access and illustrative examples
Kantesti provides AI-assisted educational information based on laboratory values, is not a medical device and is not CE- or UKCA-marked. It does not diagnose, treat, screen for, predict or monitor disease, does not replace a licensed clinician, and advises that findings should always be discussed with a doctor.
The source PDF uses an illustrative blood age of 53 beside calendar age 43, showing +10 years, rather than a real patient's results. Its example identifies HbA1c 6.4 %, LDL cholesterol 3.31 mmol/l and Magnesium 0.64 mmol/l as contributors, and directs discussion of HbA1c and LDL cholesterol to a doctor.
Julian Emirhan Bulut, Founder and Director, Kantesti Ltd, described the purpose as arranging the same report around the body and a lifetime while making clear that it is not a diagnosis. Both features are available in Kantesti reports; partners and developers can request API access, onboarding and pricing through [email protected].
Source document
Kantesti Body Map and Biological Blood Age launch press release
The four-page PDF explains the report features, illustrative results, body-region mapping, blood age calculations and derived indices. It also provides developer endpoints, authentication requirements, credit costs, availability and educational-use safeguards for journalists, clinics and developers.
Frequently asked questions
What does Body Map show, and does a highlighted organ indicate disease?
Body Map shows values outside the reference range printed on the patient's own laboratory report, grouped across 13 body regions. Its legend preserves laboratory names, results and units. Highlighting indicates the organ or system commonly associated with a marker, not a diagnosis. Values within range are not drawn, and findings should be discussed with a doctor.
Does the report estimate use the same method as the blood age API?
The report's AI engine estimates blood age from every value in the panel and the age entered by the patient, explaining which markers shaped it. The API uses Levine PhenoAge by default, based on nine routine markers and calendar age. It is deterministic by default, and optional AI assistance never overrides a complete nine-marker calculation.
When did the features become available, and how can developers obtain access?
Body Map entered Kantesti reports on 14 September 2026, followed by the blood age feature and hidden indices on 15 September 2026. Both APIs launched on 18 September 2026 alongside Blood Test Analysis v12. Partners and developers can request access, onboarding and pricing at [email protected]; documentation is available at kantesti.net/docs in 12 languages.
What do API analyses cost, and what are the request limits?
Each Body Map or blood age analysis costs 1 credit and accepts up to 500 parameters per request. Sandbox and validation endpoints are free. The Body Map call waits up to 30 seconds for its illustration. The blood age API supplies up to 18 derived clinical indices, with its default deterministic calculation carrying no extra cost.
Notes to editors
- Kantesti Ltd is registered in England and Wales, Companies House No. 17090423, at 4 Raven Road, Unit 1c3-1100, London E18 1HB, United Kingdom. Media contact: [email protected]; website: www.kantesti.net. The source document is dated 29 September 2026 and marked for immediate release.
- Kantesti Ltd turns laboratory results into clear, AI-assisted explanations for more than 2 million users. Its platform interprets blood tests uploaded as PDFs or photos in more than 100 languages and includes a body map, a biological blood age, Kantesti Voice, comparison and trend analysis, nutrition plans and DNA-based health reports for individuals and clinics. The platform also serves developers and has 39 interface languages.
- The API base URL is https://app.aibloodtestinterpret.com. GET /api/v1/body-map/regions returns 13 region keys and 3 levels; GET /api/v1/blood-age/biomarkers returns 37 markers. Region keys are brain_nerves, thyroid, heart_vessels, liver, pancreas, adrenals, kidneys, gut, reproductive, blood, immune, bones and muscles. The source cites the PhenoAge formula publication in Aging (Albany NY), 2018.
- The illustrative map places LDL Cholesterol 3.31 mmol/l in heart and blood vessels, Glycated Hemoglobin 6.4 % in pancreas and blood sugar, Serum Potassium 3.7 mmol/l in kidneys and electrolytes, and Serum Magnesium 0.64 mmol/l in bones and minerals. All four are labelled borderline, level 1. These examples are for orientation only and are not real patient results.
- The PDF's 7 illustrative hidden indices are: borderline non-HDL cholesterol 3.69 mmol/L, calculated as TC − HDL; borderline total/HDL cholesterol ratio 3.56, calculated as TC ÷ HDL; borderline estimated average glucose 137 mg/dL · 7.6 mmol/L, calculated as 28.7 × HbA1c − 46.7; in-range TG/HDL ratio 1.34, calculated as TG ÷ HDL with both in mg/dL; in-range atherogenic index of plasma −0.23, calculated as log10(TG ÷ HDL) with mmol/L values; in-range remnant cholesterol 0.38 mmol/L, calculated as TC − HDL − LDL; and in-range eGFR (CKD-EPI 2021) 124 mL/min/1.73 m², calculated from creatinine, age and sex.
- The source describes non-HDL cholesterol as cholesterol carried by atherogenic particles, total/HDL ratio as a Castelli index for the cardiovascular profile, and estimated average glucose as average blood sugar over about three months. It describes TG/HDL ratio as linked to small dense LDL and insulin resistance, higher atherogenic index of plasma as indicating a more atherogenic profile, remnant cholesterol as cholesterol in triglyceride-rich particles, and eGFR as estimated kidney filtration. Non-HDL, total/HDL, atherogenic index and remnant cholesterol are associated with heart and blood vessels; estimated average glucose with pancreas and blood sugar; and eGFR with kidneys and electrolytes. These descriptions explain calculated indices and do not establish diagnostic capability.
- Pictures accompanying the release should contain no readable text, numbers or laboratory reports.
About Kantesti
Kantesti Ltd is a UK-registered health technology company (Companies House No. 17090423) that turns laboratory results into clear, AI-assisted explanations for more than 2 million users. Its platform interprets blood tests uploaded as PDFs or photos in more than 100 languages and adds tools such as a biological blood age, a body map, comparison and trend analysis, nutrition plans, DNA-based health reports and Kantesti Voice, for individuals and clinics.
Kantesti Ltd · Companies House No. 17090423 · 4 Raven Road, Unit 1c3-1100, London E18 1HB, United Kingdom
Media contact
Kantesti Ltd — Press Office
[email protected]
+44 7508 364740
www.kantesti.net
Media assets

People
Written by
Julian Emirhan Bulut
Founder & CEO, Kantesti Ltd
Julian Emirhan Bulut is the founder and Chief Executive Officer of Kantesti Ltd. A medical AI specialist educated at the University of Milan, he leads the design of the Kantesti AI blood test analyzer, its neural-network interpretation engine and its multilingual reporting, and is accountable for every product announcement the company makes.
Reviewed by
Thomas Klein, MD
Chief Medical Officer (CMO), Kantesti Ltd
Dr. Thomas Klein is a board-certified clinical hematologist and internist with over 15 years of experience in laboratory medicine and AI-assisted clinical analysis. As Chief Medical Officer at Kantesti, he provides clinical oversight of the medical accuracy of the platform and reviews clinical statements in Kantesti publications.