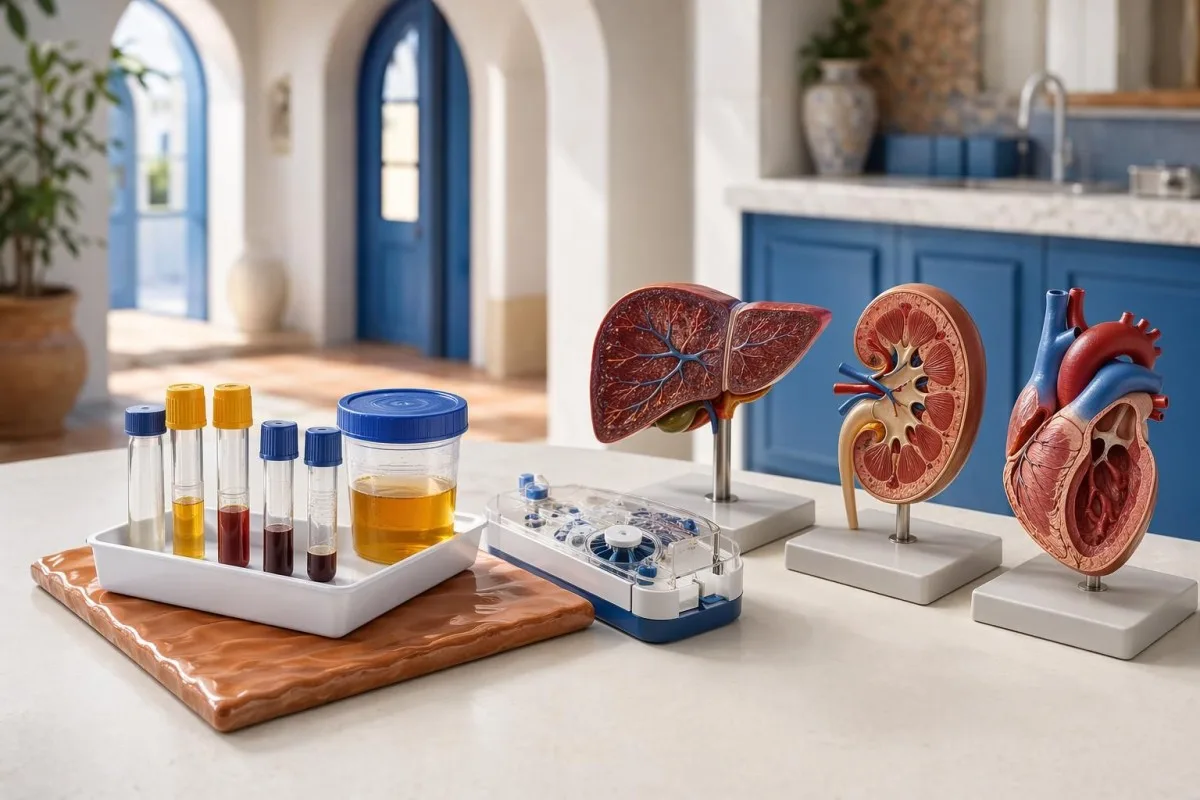
Oxidative stress can leave clues in blood and urine, but no single result proves your biological age. The useful signal comes from patterns, trends, and whether the result fits your liver, kidney, metabolic, and inflammation context.


- F2-isoprostanes are among the better validated oxidative lipid-damage markers, usually measured in urine or plasma, but reference ranges are lab-specific.
- Urinary 8-OHdG may reflect oxidative DNA repair activity, yet exercise, smoking, infection, and kidney handling can move the result without proving accelerated aging.
- hs-CRP below 1 mg/L is generally considered lower cardiovascular inflammatory risk, while values above 3 mg/L suggest higher risk if infection is excluded.
- GGT above the lab upper limit can track liver enzyme induction and oxidative burden, but alcohol, fatty liver, medications, and bile duct disease must be considered first.
- Ferritin above 300 ng/mL in women or 400 ng/mL in men deserves context; inflammation and liver disease are more common than iron overload.
- Transferrin saturation above 45% is a better prompt for iron-overload follow-up than ferritin alone.
- Homocysteine above 15 µmol/L is usually elevated and may reflect B12, folate, B6, kidney, thyroid, or genetic factors.
- A useful preventive blood test compares results over 8-12 weeks, not after one intense workout, sauna, fast, infection, or supplement experiment.
What an oxidative stress panel can and cannot tell you
A longevity blood test can suggest oxidative stress risk by combining urine F2-isoprostanes, urinary 8-OHdG, hs-CRP, GGT, uric acid, ferritin, glucose, insulin, ApoB, and nutrient markers. It cannot tell you your exact biological age, prove you need antioxidants, or justify a biohacking stack from one abnormal result. I am Thomas Klein, MD, and in my clinical reviews I treat these markers as probability signals, not verdicts.
As of May 31, 2026, no major clinical guideline recommends a single oxidative stress number for routine aging decisions. A practical panel is closer to a preventive blood test: it asks whether metabolic pressure, inflammation, iron excess, liver stress, renal clearance, and antioxidant status point in the same direction.
Kantesti AI is an AI blood test analyzer that reads oxidative-stress-adjacent markers beside routine CBC, CMP, lipid, iron, vitamin, and urine data. That matters because a urinary marker that looks high after a 24-hour fast means something different from the same value in a 58-year-old smoker with hs-CRP of 5.8 mg/L and triglycerides of 240 mg/dL.
If you want the broader marker set before adding oxidative stress tests, our guide to longevity panels is a good companion. For how we benchmark pattern interpretation, see our medical validation standards rather than treating any single marker as a consumer wellness score.
Which direct urine markers best reflect oxidative damage?
Urinary F2-isoprostanes and urinary 8-OHdG are the two direct oxidative stress markers I most often consider useful, but both are send-out tests with lab-specific ranges. F2-isoprostanes reflect lipid peroxidation, while 8-OHdG reflects oxidative DNA repair products; neither should be interpreted without creatinine correction, recent exercise history, smoking status, and infection timing.
Urinary 8-OHdG is commonly reported as a creatinine-corrected value, such as ng/mg creatinine or nmol/mmol creatinine, because dilute urine can falsely reassure. Valavanidis et al. described 8-OHdG as a useful oxidative DNA-damage biomarker in 2009, but they also stressed that environmental exposure and assay method change interpretation.
F2-isoprostanes are often treated as stronger lipid-peroxidation markers than malondialdehyde or TBARS because they are chemically stable and less prone to artifact. Milne et al. reviewed isoprostane biology in Chemical Reviews in 2011 and showed why sample handling, storage temperature, and analytic method still matter.
For readers building a biohacking panel, I usually ask for baseline testing after 48 hours without heavy exercise, sauna, alcohol, or unusually high-dose supplements. A 35-year-old cyclist I reviewed once had a high oxidative urine result after a brutal interval day; two weeks later, with normal training, it had fallen into the lab's expected range.
Which routine blood markers hint at oxidative burden?
GGT, uric acid, bilirubin, albumin, and sometimes LDH can hint at oxidative or antioxidant balance, but they are indirect markers. GGT often rises with fatty liver, alcohol exposure, medication induction, or bile duct stress; uric acid is both an antioxidant in plasma and a metabolic risk signal when persistently high.
A GGT above about 60 IU/L in adult men or above about 40 IU/L in adult women often deserves liver and medication review, although reference ranges vary by country and laboratory. Some European labs flag lower GGT values than US labs, which is one reason your own baseline matters.
Uric acid above 7.0 mg/dL in men or 6.0 mg/dL in women is commonly called hyperuricemia, but I do not label it oxidative stress by itself. A result of 8.2 mg/dL plus triglycerides of 280 mg/dL, fasting insulin of 18 µIU/mL, and ALT of 55 IU/L tells a very different story than isolated uric acid after dehydration.
Our biomarker guide covers more than 15,000 markers, but the practical first step is pattern recognition. If GGT is the standout abnormality, compare it with the dedicated GGT guide before reaching for N-acetylcysteine, milk thistle, or glutathione injections.
How do inflammaging markers change oxidative aging risk?
Inflammaging markers such as hs-CRP, ESR, fibrinogen, neutrophil-to-lymphocyte ratio, and ferritin can amplify oxidative stress risk because chronic immune activation generates reactive oxygen species. hs-CRP below 1 mg/L is generally lower cardiovascular inflammatory risk, 1-3 mg/L is intermediate, and above 3 mg/L is higher risk if acute infection is excluded.
Kaptoge et al. pooled individual participant data in The Lancet in 2010 and found that higher CRP was associated with coronary heart disease, stroke, vascular mortality, and non-vascular mortality. That does not mean CRP causes every event; it means persistent inflammation is a clinically useful risk signal.
A common trap is testing hs-CRP three days after a cold, dental work, vaccination, or hard race. A value above 10 mg/L usually suggests acute infection, tissue injury, or another inflammatory flare, so I repeat hs-CRP after 2-3 symptom-free weeks before calling it chronic risk.
For aging-focused readers, our inflammaging markers article explains why CRP, ferritin, albumin, and CBC differential often move as a cluster. I care more about hs-CRP of 3.6 mg/L repeated twice with low HDL and high waist circumference than one lonely CRP flag.
Why metabolic markers belong in an oxidative stress panel
Glucose, insulin, HbA1c, triglycerides, HDL, ApoB, and ALT belong in an oxidative stress panel because metabolic overload increases mitochondrial and vascular oxidative pressure. Fasting glucose of 100-125 mg/dL suggests impaired fasting glucose, and HbA1c of 5.7-6.4% is the usual prediabetes range.
Fasting insulin is not standardized as tightly as glucose, but values above 15-20 µIU/mL often fit insulin resistance when paired with high triglycerides or waist gain. I have seen patients with HbA1c of 5.4% but fasting insulin of 22 µIU/mL and triglycerides of 190 mg/dL; the oxidative pressure was already building before diabetes criteria appeared.
ApoB is a useful vascular particle marker because oxidized lipid exposure depends partly on how many atherogenic particles circulate. ApoB above 130 mg/dL is generally high risk, while many prevention clinicians prefer below 80 mg/dL for higher-risk adults and below 65 mg/dL for very-high-risk adults.
If your A1c looks normal but insulin seems high, review insulin resistance testing before assuming oxidative stress is a supplement deficiency. The reason we worry about high insulin plus high ApoB is simple: together they suggest metabolic fuel excess and vascular lipid exposure, not merely low antioxidants.
Which nutrient markers should be checked before antioxidants?
Vitamin D, B12, folate, magnesium, zinc, selenium, copper, vitamin E, omega-3 index, and sometimes CoQ10 can help personalize antioxidant decisions. A low nutrient level may justify replacement, but high-dose antioxidants without deficiency can blunt exercise adaptation or create new risks.
A 25-OH vitamin D level below 20 ng/mL is usually deficient, 20-29 ng/mL is often insufficient, and levels above 100 ng/mL raise toxicity concern in many laboratories. Vitamin B12 below 200 pg/mL is commonly low, but methylmalonic acid above about 0.4 µmol/L may reveal functional deficiency even when serum B12 looks borderline.
The omega-3 index is usually expressed as EPA plus DHA as a percentage of red-cell fatty acids; below 4% is low and 8% or higher is often considered a favorable cardiovascular range. That number says more about membrane fatty-acid status than a one-day fish oil dose.
Before buying mixed tocopherols or mega-dose capsules, compare your results with our omega-3 index guide. In clinic, the patients who benefit most are usually correcting a measured gap, not chasing an online antioxidant score.
When can iron and copper drive oxidative stress?
Iron and copper can drive oxidative chemistry when they are excessive, poorly bound, or paired with liver inflammation. Ferritin above 300 ng/mL in women or 400 ng/mL in men deserves context, but transferrin saturation above 45% is the result that usually pushes me to check for iron overload more seriously.
Ferritin is an iron storage marker and an acute-phase reactant, so a ferritin of 520 ng/mL with hs-CRP of 9 mg/L may reflect inflammation more than iron excess. A ferritin of 520 ng/mL with transferrin saturation of 62%, elevated ALT, and family history of liver disease is a different conversation.
Copper is trickier. Serum copper is often reported around 70-140 µg/dL in adults, but inflammation, estrogen therapy, pregnancy, and ceruloplasmin can raise it; zinc excess can push copper low and create anemia or neurologic symptoms.
For patients worried by a high ferritin flag, I usually start with the high ferritin causes article before discussing phlebotomy or supplements. Never add high-dose iron, copper, or vitamin C to a metal-abnormal panel without checking the whole iron study set.
Why kidney and liver context changes oxidative marker results
Kidney and liver function change oxidative stress results because they affect production, detoxification, and clearance. eGFR below 60 mL/min/1.73 m² for more than 3 months suggests chronic kidney disease, and albumin-creatinine ratio above 30 mg/g can reveal early renal vascular stress even when creatinine looks normal.
Urinary oxidative markers depend on urine concentration and renal handling, so creatinine correction is not a cosmetic detail. A low muscle-mass older adult can have a deceptively low urine creatinine denominator, which may make corrected values look unusual.
Liver enzymes also frame the result. ALT above about 35 IU/L in women or 45 IU/L in men is often flagged depending on the lab, but a mild ALT rise plus high GGT, high triglycerides, and high fasting insulin often points to fatty liver physiology rather than a standalone oxidative stress problem.
Our urine ACR guide explains why kidney risk can appear before creatinine changes. In my experience, a clean oxidative panel with an ACR of 80 mg/g is not reassuring; the vascular-kidney signal deserves priority.
How do exercise, sauna, fasting, and travel shift results?
Exercise, sauna, fasting, alcohol, jet lag, heat exposure, and poor sleep can shift oxidative stress markers for 24-72 hours. A hard endurance session can raise CK, AST, LDH, hs-CRP, and oxidative urine markers transiently, so testing right after a challenge can misclassify adaptation as damage.
A 52-year-old marathon runner once sent us results with AST of 89 IU/L, CK above 1,200 IU/L, and mildly high hs-CRP after a race weekend. Before panic, I asked about timing; after 10 rest days, AST fell below 35 IU/L and CK normalized.
Fasting can raise bilirubin in people with Gilbert syndrome and may alter uric acid, ketones, glucose, and hydration markers. Sauna and heat exposure can concentrate albumin, sodium, and BUN if fluid replacement is poor, creating false-looking improvement or worsening.
If you are testing around fasting or metabolic challenges, read our autophagy fasting labs before comparing results. The cleanest oxidative-stress baseline is usually collected after 2 normal sleep nights, 48 hours without heavy training, and a typical diet.
How should you build a 90-day personalized baseline?
A personalized blood test baseline should use two or three measurements over about 90 days, collected under similar conditions. One result tells you where you landed that morning; repeated results show whether oxidative, metabolic, and inflammatory pressure is stable, improving, or drifting.
Kantesti AI is an AI blood test interpretation platform built to compare your current result with prior reports, not only with population reference intervals. A GGT of 48 IU/L may be normal for one lab but meaningful if your personal 3-year baseline was 18-22 IU/L.
The 90-day interval works because red-cell markers, A1c, lipid remodeling, liver enzymes, ferritin, and supplement effects often need weeks to settle. I usually distrust dramatic claims from a protocol tested after only 7-10 days unless the marker is known to move quickly, such as glucose or CRP after infection.
Our personalized baseline guide explains why your own slope often beats a generic green range. For readers interested in the technical side, the AI technology guide shows how report upload, unit normalization, and trend detection work.
When should biohacking results lead to action?
A biohacking blood test should lead to action only when an abnormal marker is reproducible, clinically plausible, and linked to a safe intervention. I am comfortable acting on ferritin of 18 ng/mL with fatigue and low transferrin saturation, but I am cautious about acting on one high 8-OHdG result after travel and poor sleep.
N-acetylcysteine, vitamin C, vitamin E, curcumin, CoQ10, omega-3, magnesium, and polyphenols all have plausible roles, but dose and context matter. Vitamin E above 1,000 mg/day can raise bleeding concerns, and high-dose vitamin C may be unwise in people with iron overload or kidney stone history.
The evidence for antioxidant supplements in healthy people is honestly mixed. In patients with deficiency, replacement can be sensible; in well-nourished endurance athletes, high-dose antioxidants may reduce training adaptation signals that rely partly on reactive oxygen species.
If you are considering NAC because GGT or glutathione markers worry you, start with our NAC lab guide. My practical rule is dull but safe: change one variable, keep it for 8-12 weeks, and retest the marker you are trying to move.
Which red flags need medical review first?
Chest pain, unexplained weight loss, black stools, jaundice, severe fatigue, very high CRP, falling hemoglobin, high creatinine, or abnormal liver enzymes should be medically reviewed before any optimization plan. Biohacking should never delay diagnosis of infection, autoimmune disease, cancer, kidney disease, liver disease, or bleeding.
When I review these cases as Thomas Klein, MD, the pattern that worries me is not one amber wellness marker; it is a cluster. Hemoglobin below 10 g/dL, platelets above 600 x 10⁹/L, CRP above 50 mg/L, or creatinine rising by 0.3 mg/dL within 48 hours can change the urgency completely.
A smoker with high F2-isoprostanes, hs-CRP of 4.5 mg/L, and hemoglobin of 17.8 g/dL needs cardiovascular and respiratory risk review, not only antioxidant capsules. A postmenopausal adult with ferritin of 12 ng/mL needs blood-loss evaluation before iron is treated as a simple nutrition gap.
Our article on abnormal result clusters is useful when several flags appear together. The practical takeaway is simple: fix dangerous diagnoses first, then optimize.
How Kantesti AI interprets oxidative stress patterns
Kantesti AI interprets oxidative stress patterns by grouping direct markers, metabolic markers, inflammation markers, nutrient status, organ clearance, medications, and timing details. Kantesti AI is an AI biomarker interpretation platform that can read uploaded blood test PDFs or photos in about 60 seconds, but it still frames results as clinical probabilities rather than diagnoses.
Our neural network is designed to notice contradictions, such as high ferritin with low transferrin saturation, high AST with normal ALT after exercise, or low creatinine in a frail older adult. Those combinations matter because they can stop a confident but wrong supplement recommendation.
Kantesti AI can translate units, compare trends, and flag when a result looks biologically inconsistent with the rest of the panel. For example, an isolated potassium of 6.1 mmol/L with normal kidney markers may prompt a lab-error or sample-handling check rather than a longevity intervention.
Patients who use PDF upload should still discuss urgent or unexplained abnormalities with a clinician. Our medical advisory board reviews clinical standards so that longevity interpretation stays anchored to real medicine, not just wellness curiosity.
Research publications and further reading
The research section should help readers separate clinical evidence from product claims. The two Kantesti DOI publications below are not oxidative-stress treatment guidelines; they document related clinical interpretation workflows, citation practices, and laboratory-context reasoning used across hematology and gastrointestinal topics.
Kantesti AI is an AI-powered blood test analysis tool used internationally, and our organization details are available through About Us. For oxidative stress specifically, I rely more heavily on peer-reviewed biomarker literature, repeat testing, and standard cardiometabolic risk markers than on any proprietary wellness score.
Kantesti LTD. (2026). B Negative Blood Type, LDH Blood Test & Reticulocyte Count Guide. Figshare. https://doi.org/10.6084/m9.figshare.31333819. ResearchGate: https://www.researchgate.net/search/publication?q=B%20Negative%20Blood%20Type%20LDH%20Blood%20Test%20Reticulocyte%20Count%20Guide. Academia.edu: https://www.academia.edu/search?q=B%20Negative%20Blood%20Type%20LDH%20Blood%20Test%20Reticulocyte%20Count%20Guide.
Kantesti LTD. (2026). Diarrhea After Fasting, Black Specks in Stool & GI Guide 2026. Figshare. https://doi.org/10.6084/m9.figshare.31438111. ResearchGate: https://www.researchgate.net/search/publication?q=Diarrhea%20After%20Fasting%20Black%20Specks%20in%20Stool%20GI%20Guide%202026. Academia.edu: https://www.academia.edu/search?q=Diarrhea%20After%20Fasting%20Black%20Specks%20in%20Stool%20GI%20Guide%202026.
Frequently Asked Questions
What is the best blood test for oxidative stress?
There is no single best blood test for oxidative stress, because oxidative damage affects lipids, DNA, proteins, metabolism, and inflammation differently. Urinary or plasma F2-isoprostanes are among the better validated lipid-peroxidation markers, while urinary 8-OHdG can reflect oxidative DNA repair activity. In practice, I pair these with hs-CRP, GGT, ferritin with transferrin saturation, glucose, insulin, ApoB, kidney function, and liver enzymes. A repeated pattern over 8-12 weeks is more useful than one abnormal result.
Can a longevity blood test measure biological age?
A longevity blood test can estimate risk patterns linked to aging, but it cannot precisely measure biological age by itself. Markers such as hs-CRP above 3 mg/L, HbA1c in the 5.7-6.4% range, ApoB above 130 mg/dL, or eGFR below 60 mL/min/1.73 m² may indicate higher future risk when persistent. These results need age, sex, medications, fitness level, kidney function, liver function, and recent illness context. Biological-age calculators can be interesting, but they should not replace clinical diagnosis or risk management.
Are urinary 8-OHdG results reliable?
Urinary 8-OHdG can be useful when collected and interpreted carefully, but it is not a standalone diagnosis of oxidative stress. The result should usually be corrected for urine creatinine because hydration changes concentration. Smoking, infection, intense exercise, environmental exposure, and kidney handling can all raise or alter 8-OHdG values. I prefer repeating an unexpected result under stable conditions before recommending supplements.
Should I take antioxidants if my oxidative stress markers are high?
You should not automatically take high-dose antioxidants because an oxidative marker is high. First check whether the driver is smoking, sleep apnea, high glucose, high ApoB, fatty liver, inflammation, iron overload, kidney disease, or recent heavy exercise. Nutrient replacement is reasonable when a true deficiency is present, such as vitamin D below 20 ng/mL or B12 below 200 pg/mL with supportive findings. High-dose vitamin E, vitamin C, iron, copper, or mixed supplement stacks can create harm in the wrong context.
How often should oxidative stress labs be repeated?
Most oxidative-stress-adjacent labs are best repeated after 8-12 weeks if you are testing a lifestyle or supplement change. hs-CRP should be repeated after at least 2-3 symptom-free weeks if the first value was taken near infection, vaccination, dental work, or injury. Direct urine markers such as F2-isoprostanes or 8-OHdG should be collected under similar sleep, diet, exercise, and hydration conditions. Repeating too quickly often measures noise rather than improvement.
Which routine labs are most useful for oxidative aging risk?
The most useful routine labs for oxidative aging risk are hs-CRP, fasting glucose, HbA1c, fasting insulin, triglycerides, HDL, ApoB, ALT, GGT, ferritin with transferrin saturation, uric acid, creatinine with eGFR, urine albumin-creatinine ratio, and CBC differential. hs-CRP below 1 mg/L is generally lower inflammatory risk, while above 3 mg/L is higher risk if acute illness is excluded. Transferrin saturation above 45% can suggest iron overload evaluation, especially with high ferritin. These routine markers often explain more actionable risk than expensive oxidative assays alone.
Should I stop antioxidant supplements before an oxidative stress test?
Antioxidant supplements can change some biomarkers and may make a single result harder to compare with your usual baseline. Do not stop prescribed treatment; instead, record the product, dose, and timing, and ask your clinician whether testing on your regular routine is appropriate.
Can smoking or vaping affect oxidative stress test results?
Yes. Cigarette smoking can raise oxidative-damage and inflammation markers, so disclose current smoking and recent changes when results are reviewed. Vaping may also contribute to oxidative stress, although its long-term effect is less certain; stopping tobacco remains the most meaningful intervention.
Can poor sleep affect oxidative stress lab results?
Yes. A few nights of short or disrupted sleep can raise inflammation, worsen glucose control, and indirectly shift oxidative-stress-related markers. For a cleaner baseline, aim for several normal sleep nights before testing when possible.
Get AI-Powered Blood Test Analysis Today
Join over 2 million users worldwide who trust Kantesti for instant, accurate lab test analysis. Upload your blood test results and receive comprehensive interpretation of 15,000+ biomarkers in seconds.
📚 Referenced Research Publications
Klein, T., Mitchell, S., & Weber, H. (2026). B Negative Blood Type, LDH Blood Test & Reticulocyte Count Guide. Kantesti AI Medical Research.
Klein, T., Mitchell, S., & Weber, H. (2026). Diarrhea After Fasting, Black Specks in Stool & GI Guide 2026. Kantesti AI Medical Research.
📖 External Medical References
⚕️ Medical Disclaimer
This article is for educational purposes only and does not constitute medical advice. Always consult a qualified healthcare provider for diagnosis and treatment decisions.
E-E-A-T Trust Signals
Experience
Physician-led clinical review of lab interpretation workflows.
Expertise
Laboratory medicine focus on how biomarkers behave in clinical context.
Authoritativeness
Written by Dr. Thomas Klein with review by Dr. Sarah Mitchell and Prof. Dr. Hans Weber.
Trustworthiness
Evidence-based interpretation with clear follow-up pathways to reduce alarm.