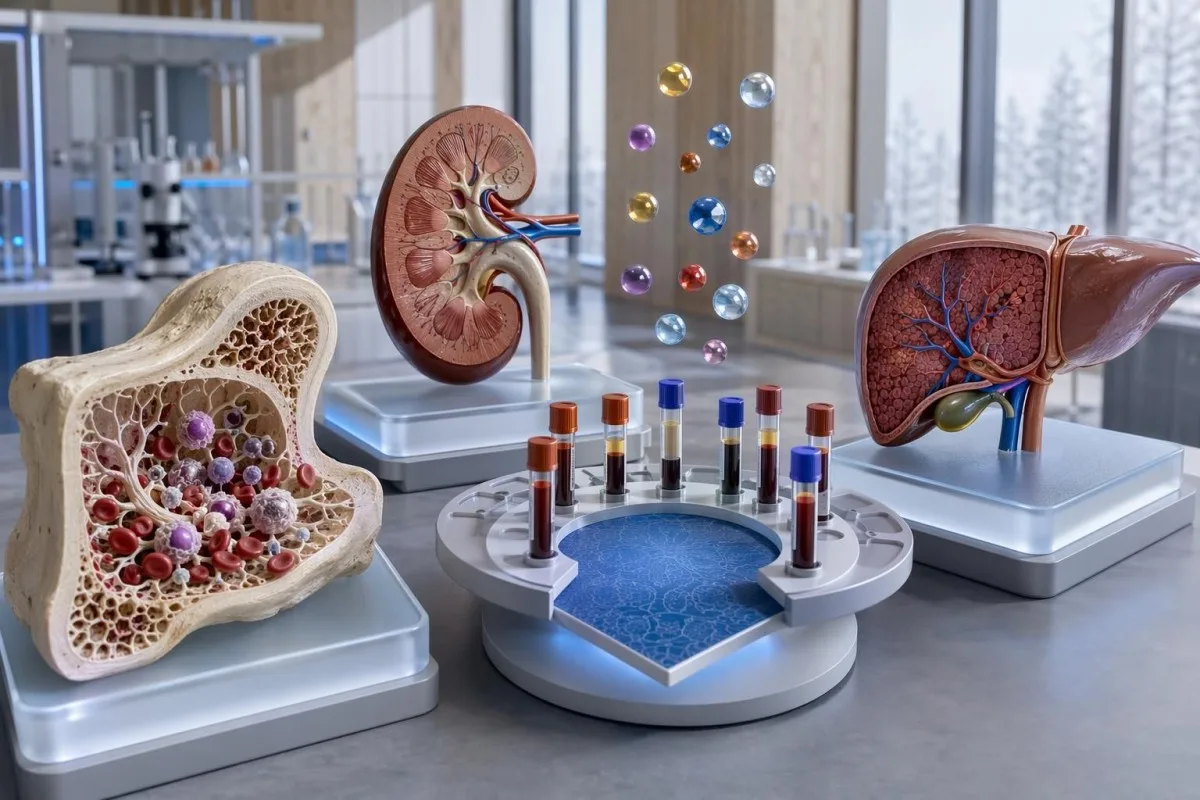
Chemotherapy labs are meant to move. The skill is knowing which changes fit the treatment cycle, which need same-day oncology advice, and which trends deserve a calmer follow-up conversation.


- ANC nadir usually occurs 7-14 days after many chemotherapy infusions; an ANC below 500/µL with fever is an emergency until proven otherwise.
- Fever rule means calling urgently for one temperature of 38.3°C or higher, or 38.0°C lasting about 1 hour, especially during neutropenia.
- Platelets normally run about 150-450 x10^9/L; values below 50 x10^9/L raise activity and procedure concerns, while below 10 x10^9/L often triggers prophylactic transfusion in stable patients.
- Hemoglobin below 8 g/dL, or anemia with chest pain, breathlessness, fainting, or fast heart rate, usually needs prompt oncology review.
- Creatinine and eGFR are checked before nephrotoxic drugs; a creatinine rise of 0.3 mg/dL in 48 hours can meet acute kidney injury criteria.
- ALT and AST above 3 times the upper limit of normal may lead to closer monitoring, while levels above 5 times the upper limit often affect chemotherapy dosing.
- Potassium below 3.0 mmol/L or above 5.5 mmol/L can affect heart rhythm and should not be treated casually during chemotherapy.
- Blood test trend analysis works best when you compare the same lab, same units, cycle day, hydration status, and recent medications.
Why chemotherapy blood tests change by cycle day
To understand chemotherapy labs, first match each result to the treatment day. As of May 31, 2026, the safest way to interpret blood test changes during chemotherapy is to compare the current CBC, kidney panel, liver panel, and electrolytes with the cycle number, day since infusion, symptoms, and the oncologist's dose plan.
I am Thomas Klein, MD, and when I review chemotherapy labs, I start with a calendar before I start with the red flags. A white count of 2.1 x10^9/L on day 10 after treatment can be expected, while the same number before the next infusion may delay treatment; our biomarker guide explains why single values need context.
Kantesti is an AI blood test interpretation platform that helps patients compare CBC, kidney, liver, and electrolyte reports without replacing oncology advice. The practical pattern is simple: baseline labs before treatment, early chemistry checks when nausea or dehydration is likely, a blood count nadir around days 7-14 for many regimens, then recovery before the next cycle.
The thing is, cancer regimens differ. Weekly paclitaxel, 3-week platinum therapy, oral capecitabine, immunotherapy combinations, and targeted agents do not share one tidy timeline, so your oncology team's protocol always outranks a generic reference range.
The cycle-day question to ask first
Ask this before interpreting a flagged result: was the sample drawn before treatment, at the expected nadir, or during recovery? That one detail can change the meaning of an ANC of 900/µL from expected monitoring to a dose-hold discussion.
How to read WBC, neutrophils, and ANC during chemotherapy
The absolute neutrophil count, or ANC, is the CBC value most tied to bacterial infection risk during chemotherapy. ANC is calculated from the white blood cell count and neutrophil percentage, and severe neutropenia is usually defined as ANC below 500/µL.
A normal adult ANC is commonly above 1500/µL, mild neutropenia is 1000-1500/µL, moderate neutropenia is 500-1000/µL, and severe neutropenia is below 500/µL. If your report lists only percentages, use the absolute count; our guide to absolute counts shows why percentages can mislead.
Many cytotoxic regimens push neutrophils down 7-14 days after infusion because bone marrow precursor cells are temporarily suppressed. I see patients worry when WBC falls from 6.8 to 2.4 x10^9/L, but the more meaningful question is whether the ANC is 1800/µL or 300/µL.
Steroids can briefly raise neutrophils by moving cells from vessel walls into circulation, so a high neutrophil count 24-48 hours after dexamethasone does not always mean bacterial illness. A left shift with bands, fever, rigors, or low blood pressure changes the story fast.
What platelet drops mean after chemotherapy
Chemotherapy-related platelet drops matter because platelets help clotting, procedures, and bleeding prevention. A normal platelet count is about 150-450 x10^9/L, and most oncology teams become more cautious below 50 x10^9/L.
Platelets often fall after neutrophils, sometimes around days 10-21 depending on the drug and marrow reserve. For deeper reference ranges, see our platelet count guide, but remember that chemotherapy decisions use your personal baseline too.
A platelet count of 95 x10^9/L may look alarming to a patient who usually sits at 280 x10^9/L, yet it may not cause bleeding by itself. The reasons we worry more below 20 x10^9/L are practical: spontaneous nosebleeds, gum bleeding, petechiae, and harder-to-control bleeding become more likely.
Call the oncology team if you notice black stools, red urine, repeated nosebleeds lasting more than 10 minutes, new pinpoint purple spots, or a severe headache after a platelet drop. Aspirin, ibuprofen, fish oil at high doses, and anticoagulants can shift the risk even when the platelet number seems acceptable.
How hemoglobin and red cell indices explain chemo fatigue
Hemoglobin shows oxygen-carrying capacity, and chemotherapy can lower it gradually across cycles. Anemia is often defined as hemoglobin below 13 g/dL in adult men and below 12 g/dL in adult women, but symptoms and rate of fall matter more than the label.
A drop from 12.2 to 10.1 g/dL over two cycles can cause fatigue, but it is not the same as a sudden fall from 11.0 to 7.4 g/dL. Our anemia pattern guide walks through MCV, RDW, ferritin, B12, and reticulocytes when the CBC suggests more than treatment suppression.
MCV below 80 fL suggests microcytosis, often from iron restriction or thalassemia trait, while MCV above 100 fL can appear after antifolates, B12 deficiency, liver stress, or marrow recovery. Reticulocytes tell you whether the marrow is responding; a low reticulocyte count with low hemoglobin can mean underproduction.
Many oncology services consider transfusion around hemoglobin 7-8 g/dL, or higher if the patient has chest pain, severe breathlessness, active bleeding, or cardiac disease. Clinicians disagree on exact cutoffs because quality of life, tumor type, and treatment intent all matter.
The misleading fatigue trap
Fatigue during chemotherapy is not automatically anemia. A person with hemoglobin 11.4 g/dL may feel worse from dehydration, low sodium, poor sleep, steroid withdrawal, thyroid shifts, or depression than from the hemoglobin itself.
Which lab clues suggest infection risk during chemotherapy
Fever plus neutropenia is the infection pattern oncology teams treat urgently because serious bacterial illness can progress quickly. The classic fever threshold is one temperature of 38.3°C or higher, or 38.0°C sustained for about 1 hour, with ANC below 500/µL or expected to fall below 500/µL.
Freifeld et al. in the 2011 IDSA guideline recommend rapid evaluation and empiric antibiotics for febrile neutropenia, because early symptoms may be muted when neutrophils are low. A normal CRP or procalcitonin does not rule out danger in the first hours; our infection blood test guide compares these markers with CBC clues.
Look for combinations, not heroic single markers. ANC below 500/µL plus fever, lactate elevation, creatinine rise, low blood pressure, confusion, or oxygen saturation below 92% is much more concerning than a modest CRP rise alone.
Klastersky et al. in the 2016 ESMO guideline describe risk stratification for febrile neutropenia, but patients should not self-score at home to decide whether to wait. If you are on chemotherapy and have fever, rigors, or feel suddenly unwell, call the oncology number you were given.
How creatinine, eGFR, and BUN shift with chemotherapy
Kidney blood tests change during chemotherapy because dehydration, cisplatin-type drugs, contrast scans, antibiotics, and tumor breakdown can all affect filtration. Creatinine, eGFR, BUN, potassium, phosphate, calcium, and uric acid should be read together, not separately.
A creatinine rise of 0.3 mg/dL within 48 hours can meet acute kidney injury criteria, even if the final number is still near the lab range. For the components of renal monitoring, our renal function panel guide explains creatinine, BUN, eGFR, bicarbonate, and electrolytes.
KDIGO's 2024 CKD guideline emphasizes that eGFR should be interpreted with albuminuria, trend, and clinical setting, not as a lone number. During chemotherapy, an eGFR drop from 82 to 54 mL/min/1.73 m² before a nephrotoxic infusion may trigger hydration, dose adjustment, or a delay.
BUN rises faster than creatinine in dehydration, high protein intake, steroid exposure, or gastrointestinal bleeding. A BUN-to-creatinine ratio above 20 can suggest reduced circulating volume, but I still ask about vomiting, diarrhea, diuretics, and recent CT contrast before blaming the kidneys.
Cisplatin and the magnesium clue
Cisplatin can waste magnesium through renal tubular injury, so falling magnesium may appear before a dramatic creatinine rise. A magnesium below 1.6 mg/dL during platinum therapy deserves a practical replacement plan from the oncology team.
What AST, ALT, ALP, GGT, and bilirubin say during chemo
Liver tests during chemotherapy show whether liver cells, bile flow, or bilirubin handling are stressed. ALT and AST above 3 times the upper limit of normal often prompt closer monitoring, while values above 5 times the upper limit may affect treatment timing or dose.
ALT is more liver-specific than AST, while AST can rise from muscle injury, hemolysis, or strenuous exercise. Our liver function test guide helps separate hepatocellular patterns from cholestatic ones before you assume the chemotherapy is the only cause.
ALP and GGT rising together point more toward bile duct or cholestatic stress, while isolated ALP can come from bone. Bilirubin above 2.0 mg/dL during treatment is more serious when direct bilirubin is elevated, urine is dark, stools are pale, or the patient is jaundiced.
Some European labs use lower upper reference limits for ALT than older North American reports, so a value called mildly high in one system may be normal in another. This is one reason blood test comparison across hospitals needs unit and reference range review, not just flag counting.
Why sodium, potassium, magnesium, and calcium can swing
Electrolytes can shift quickly during chemotherapy because vomiting, diarrhea, kidney effects, appetite changes, IV fluids, and medications alter body water and mineral balance. Sodium below 130 mmol/L, potassium below 3.0 mmol/L, potassium above 5.5 mmol/L, or magnesium below 1.2 mg/dL deserves prompt clinical advice.
Kantesti is an AI-powered blood test analysis tool used by 2M+ people across 127 countries, and electrolyte pattern recognition is one area where trend context matters enormously. Our electrolyte panel guide explains sodium, potassium, chloride, bicarbonate, calcium, and magnesium in the same clinical frame.
Low sodium may reflect excess free water, nausea-driven ADH release, kidney salt wasting, certain anticancer drugs, or adrenal issues from steroid changes. A sodium of 128 mmol/L with confusion, seizure, severe headache, or repeated vomiting is not a wait-and-see lab.
Potassium is the rhythm marker patients underestimate. Potassium below 3.0 mmol/L can cause weakness and arrhythmia risk, while potassium above 6.0 mmol/L can be dangerous even before symptoms appear, especially when creatinine is rising.
Corrected calcium matters
Total calcium falls when albumin is low, so corrected calcium or ionized calcium may be needed. A total calcium of 8.0 mg/dL with albumin 2.5 g/dL can look low even when biologically active calcium is closer to normal.
How hydration, albumin, and glucose distort results
Hydration and nutrition can make chemotherapy labs look better or worse than the underlying biology. Dehydration can concentrate hemoglobin, albumin, sodium, BUN, and creatinine, while IV fluids can dilute several markers within hours.
Albumin normally sits around 3.5-5.0 g/dL in many adult labs, but low albumin during chemotherapy may reflect inflammation, low intake, liver synthesis changes, kidney loss, or fluid overload. Our guide to low albumin shows why swelling and urine protein change interpretation.
Dexamethasone can raise glucose for 24-72 hours after infusion, particularly in people with prediabetes or diabetes. A glucose of 220 mg/dL after steroid premedication is different from fasting glucose 220 mg/dL on a non-treatment morning, though both deserve a plan.
I see this pattern often: creatinine 1.35 mg/dL, BUN 38 mg/dL, sodium 132 mmol/L, and hemoglobin slightly high after two days of vomiting. The fix may involve antiemetics and fluids, but persistent changes still need the oncology team because dehydration can make nephrotoxic chemotherapy riskier.
Do not over-correct at home
Aggressive water intake can worsen low sodium, and unsupervised potassium replacement can be unsafe if kidney function is falling. Ask your team whether oral rehydration, IV fluids, or medication changes fit your exact numbers.
How to compare chemotherapy labs without overreacting
Blood test trend analysis during chemotherapy should compare the same marker across the same cycle day, same units, and same laboratory when possible. A one-point abnormality is less useful than a slope across 2-4 results tied to symptoms and treatment dates.
Kantesti AI interprets chemotherapy-adjacent lab reports by checking patterns across CBC, kidney, liver, and electrolyte markers, but the oncology plan remains the decision source. For patients learning how to understand lab results over time, our trend analysis guide explains slopes, swings, and baseline drift.
Unit changes create false alarms. Creatinine 88 µmol/L and creatinine 1.0 mg/dL are roughly the same result, while hemoglobin 10 g/dL and 100 g/L are also equivalent; our guide to different units can prevent unnecessary panic.
A good blood test comparison includes at least 4 facts: cycle day, exact regimen, recent fever or dehydration, and recent drugs such as steroids, antibiotics, diuretics, or growth factors. Without those, even a clever graph can tell the wrong story.
A real-world pattern
A patient whose ANC drops to 700/µL every day 10 and recovers to 1900/µL by day 21 may be following a predictable marrow cycle. The same ANC of 700/µL before the next infusion is a different clinical problem.
Which chemotherapy support medicines alter lab results
Supportive medicines can change CBC and chemistry results even when chemotherapy is working as planned. Growth factors, steroids, antiemetics, antibiotics, diuretics, anticoagulants, and supplements all leave fingerprints on lab reports.
G-CSF medicines can raise neutrophils sharply, sometimes above 20 x10^9/L, and may create immature granulocyte flags on automated differentials. Our medication monitoring guide covers why timing after a drug dose matters as much as the lab value itself.
Steroids commonly raise glucose, neutrophils, and sometimes liver enzymes, while lowering eosinophils. A low eosinophil count after dexamethasone is rarely the headline, but it can help explain why the differential looks different from your pre-treatment baseline.
Antibiotics can raise creatinine, alter liver enzymes, or affect potassium depending on the agent. Trimethoprim can increase creatinine without true GFR decline in some patients, while amphotericin-type drugs can lower potassium and magnesium substantially.
Supplements are not invisible
High-dose biotin can interfere with some immunoassays, and concentrated green tea extract has been linked to liver enzyme injury in susceptible people. Bring a full supplement list, including doses in mg or IU, to each oncology review.
When should patients call their oncology team about labs
Patients on chemotherapy should call their oncology team urgently for fever, severe symptoms, or lab values linked to infection, bleeding, kidney injury, liver injury, or dangerous electrolyte changes. Do not wait for the next appointment if symptoms are new, severe, or worsening.
Call the same day for temperature 38.3°C or higher once, 38.0°C lasting about 1 hour, shaking chills, ANC below 500/µL, platelets below 20 x10^9/L, potassium above 5.5 mmol/L, sodium below 130 mmol/L with symptoms, or creatinine rising quickly. Our critical values guide gives broader lab safety context, but chemotherapy protocols are stricter.
Lyman et al. in the 2018 ASCO/IDSA guideline discuss outpatient management only for carefully selected low-risk febrile neutropenia patients after clinical assessment. That means a patient should not decide at home that fever is low-risk because they feel mostly okay.
Dr. Thomas Klein's practical rule is blunt: if the symptom scares you more than the number, call. New confusion, fainting, chest pain, shortness of breath, uncontrolled vomiting, black stools, reduced urination, or severe abdominal pain beats any reassuring app interpretation.
What to say on the phone
Give the oncology nurse four numbers first: temperature, ANC or WBC, platelets, and creatinine or eGFR. Then add cycle day, last treatment date, and whether you took acetaminophen, ibuprofen, antibiotics, or steroids.
How Kantesti AI can support oncology lab review
AI can help organize chemotherapy lab trends, but it should not replace the oncology team that knows the cancer type, regimen, scans, and treatment intent. The safest use is pattern recognition, question preparation, and spotting mismatched units or missing context.
Kantesti is an AI biomarker interpretation platform that reads lab reports in clinical context, including CBC differentials, renal panels, liver enzymes, and electrolyte clusters. The way our AI works is described in our technology guide, including document parsing and biomarker mapping.
Our clinical standards are built around safety: flags are framed as follow-up prompts, not diagnoses, and oncology-specific red flags should be escalated to the treating team. Readers who want the validation framework can review our medical validation page, which explains physician review and benchmarking principles.
If you upload a PDF or photo, remove unrelated personal pages and include the lab date, reference ranges, and units. The PDF upload guide explains why blurry screenshots, cropped reference ranges, and mixed-unit reports can weaken interpretation.
Patients who want to try organizing a recent report can use the free blood test analysis workflow, but chemotherapy fever, severe neutropenia, chest pain, or dangerous electrolytes should be handled by urgent clinical care first. Fast interpretation is helpful; urgent care is different.
Research publications and medical review behind our method
Kantesti research publications document how our AI blood test interpretation work is validated, audited, and updated. For chemotherapy content, physician review matters because lab numbers can change treatment timing, infection triage, and medication safety.
Thomas Klein, MD, reviews Kantesti oncology-adjacent education with a conservative rule: any chemotherapy lab pattern that could signal infection, kidney injury, liver injury, or dangerous electrolyte imbalance must direct the patient back to their oncology team. Our physicians and advisors are listed on the medical advisory board page.
Kantesti's neural network is also evaluated through broader blood test interpretation benchmarks, including a population-scale validation project available as clinical validation research. These studies do not make AI a substitute for oncology care, but they do explain how we test pattern recognition and safety boundaries.
Kantesti Ltd. (2026). C3 C4 Complement Blood Test & ANA Titer Guide. Zenodo. DOI: 10.5281/zenodo.18353989. ResearchGate: ResearchGate. Academia.edu: Academia.edu.
Kantesti Ltd. (2026). Nipah Virus Blood Test: Early Detection & Diagnosis Guide 2026. Zenodo. DOI: 10.5281/zenodo.18487418. ResearchGate: ResearchGate publications. Academia.edu: Academia.edu papers.
Frequently Asked Questions
What blood test changes are expected after chemotherapy?
Expected blood test changes after many chemotherapy regimens include a falling ANC around days 7-14, possible platelet decline around days 10-21, gradual hemoglobin reduction across cycles, and temporary kidney, liver, or electrolyte shifts. The exact timing depends on the drug, dose, baseline marrow reserve, and whether growth factor support is used. A predictable mid-cycle ANC drop can be monitored, but fever or severe symptoms changes the urgency immediately.
What is the most dangerous CBC result during chemotherapy?
The most urgent CBC pattern during chemotherapy is fever with severe neutropenia, usually ANC below 500/µL or expected to fall below 500/µL. A temperature of 38.3°C once, or 38.0°C sustained for about 1 hour, should prompt urgent oncology advice. Low platelets below 20 x10^9/L with bleeding symptoms and hemoglobin near 7-8 g/dL with breathlessness or chest pain also need prompt assessment.
When is the chemotherapy nadir for white blood cells?
The white blood cell and neutrophil nadir often occurs 7-14 days after many cytotoxic chemotherapy infusions, but some regimens reach their lowest point earlier or later. Weekly regimens and oral chemotherapy schedules may not follow the classic 3-week cycle pattern. The safest interpretation compares the ANC with the exact cycle day, previous nadirs, symptoms, and the oncology team's expected timeline.
Can chemotherapy affect kidney and liver blood tests?
Yes, chemotherapy can affect kidney and liver blood tests through direct drug effects, dehydration, tumor breakdown, antibiotics, contrast scans, and reduced intake. Creatinine rising by 0.3 mg/dL within 48 hours can meet acute kidney injury criteria, and ALT or AST above 3-5 times the upper limit of normal may change monitoring or dosing. Bilirubin above 2.0 mg/dL with jaundice, dark urine, or abdominal pain needs prompt oncology review.
Which electrolyte results should I call about during chemotherapy?
During chemotherapy, sodium below 130 mmol/L with confusion, seizure, severe headache, or vomiting needs urgent advice. Potassium below 3.0 mmol/L or above 5.5 mmol/L can affect heart rhythm, especially when kidney function is changing. Magnesium below 1.2 mg/dL, calcium symptoms such as spasms or confusion, or any electrolyte shift with fainting or palpitations should be discussed with the oncology team promptly.
How can I compare blood test results between chemotherapy cycles?
Compare chemotherapy blood tests by using the same lab when possible, checking the units, and matching results to the same cycle day. Creatinine reported in µmol/L, hemoglobin in g/L, and neutrophils in x10^9/L can look very different from mg/dL, g/dL, and cells/µL unless converted correctly. A useful comparison includes treatment date, cycle number, recent fever, hydration status, and medications such as steroids or growth factors.
Can I get flu or COVID-19 vaccines while receiving chemotherapy?
Non-live vaccines such as influenza and COVID-19 vaccines are usually appropriate during chemotherapy, but your oncology team should choose the timing. They may schedule vaccination between cycles or when counts are recovering; avoid live vaccines unless your cancer team specifically approves them.
Should I schedule dental work while I am receiving chemotherapy?
Ask your oncology team before elective cleaning, extraction, or deep scaling, because safe timing depends on your ANC, platelet count, and treatment schedule. Seek prompt dental care for facial swelling, drainage, fever, or severe tooth pain rather than waiting for the next cycle.
Can I take over-the-counter pain relievers if my platelets are low during chemotherapy?
Ask your oncology team before taking ibuprofen, naproxen, aspirin, or similar medicines, because they can increase bleeding risk or affect kidney function. Acetaminophen may be safer for some patients, but it can mask fever, so confirm your plan first.
Get AI-Powered Blood Test Analysis Today
Join over 2 million users worldwide who trust Kantesti for instant, accurate lab test analysis. Upload your blood test results and receive comprehensive interpretation of 15,000+ biomarkers in seconds.
📚 Referenced Research Publications
Klein, T., Mitchell, S., & Weber, H. (2026). C3 C4 Complement Blood Test & ANA Titer Guide. Kantesti AI Medical Research.
Klein, T., Mitchell, S., & Weber, H. (2026). Nipah Virus Blood Test: Early Detection & Diagnosis Guide 2026. Kantesti AI Medical Research.
📖 External Medical References
KDIGO CKD Work Group (2024). KDIGO 2024 Clinical Practice Guideline for the Evaluation and Management of Chronic Kidney Disease. Kidney International.
⚕️ Medical Disclaimer
This article is for educational purposes only and does not constitute medical advice. Always consult a qualified healthcare provider for diagnosis and treatment decisions.
E-E-A-T Trust Signals
Experience
Physician-led clinical review of lab interpretation workflows.
Expertise
Laboratory medicine focus on how biomarkers behave in clinical context.
Authoritativeness
Written by Dr. Thomas Klein with review by Dr. Sarah Mitchell and Prof. Dr. Hans Weber.
Trustworthiness
Evidence-based interpretation with clear follow-up pathways to reduce alarm.