
A longevity diet is best monitored with ApoB or non-HDL cholesterol, triglycerides, HbA1c or fasting glucose, kidney measures, selected nutrient tests, and context-sensitive hs-CRP. No blood panel can prove that you will live longer; its real value is showing whether an eating pattern is moving established risk markers in a favourable direction.



- ApoB below 90 mg/dL is a reasonable primary-prevention target for many adults, while 130 mg/dL or higher is an ACC risk-enhancing level.
- HbA1c of 5.7-6.4% indicates prediabetes; 6.5% or higher requires confirmation unless classic high-glucose symptoms are present.
- Triglycerides below 150 mg/dL are desirable; persistent values of 500 mg/dL or higher need prompt clinical attention because pancreatitis risk rises.
- hs-CRP above 10 mg/L should usually be repeated after acute illness, strenuous exercise, and dental treatment have settled.
- eGFR below 60 mL/min/1.73 m² for at least 3 months can indicate chronic kidney disease, especially with urine albumin present.
- Ferritin below 15 ng/mL strongly supports depleted iron stores when acute inflammation is absent, but a normal ferritin can be misleading when CRP is high.
- 25-hydroxyvitamin D of 20 ng/mL or above is sufficient for most people’s bone health according to National Academy of Medicine thresholds.
- Trend quality improves when you use the same laboratory, similar fasting conditions, and a repeat interval of roughly 8-12 weeks after a genuine dietary change.
The Core Markers a Longevity-Style Eating Pattern Can Change
The most useful longevity diet panel includes ApoB or non-HDL cholesterol, triglycerides, HbA1c or fasting glucose, creatinine with eGFR, liver enzymes, hs-CRP, and targeted nutrient tests. These markers measure cardiometabolic risk and nutritional adequacy; they do not measure lifespan or biological age directly.

I am Dr. Thomas Klein, and the pattern I look for is direction rather than a perfect score. Kantesti is an AI blood test analyzer that reads the lipid, glucose, kidney, liver, and nutrient portions of a report together, because an isolated LDL result or a single vitamin result is rarely the whole story. Our biomarker reference guide helps put unfamiliar test names into that wider panel.
A person can eat legumes, vegetables, nuts, olive oil, fish, and minimally processed grains for 4 months, lose no weight, and still see triglycerides fall from 186 to 104 mg/dL. That is meaningful. Conversely, a lean endurance athlete can have excellent glucose results but an ApoB of 122 mg/dL, which deserves a separate cardiovascular conversation rather than reassurance based on fitness alone.
Across the 2M+ reports processed by Kantesti, the clinically useful question is usually: what changed together? Falling triglycerides plus stable ApoB, lower fasting glucose, and preserved ferritin tell a more coherent story than any fashionable “longevity score.” As of July 26, 2026, I would not use a commercial blood panel to promise extra years of life.
Set a Baseline Before You Change Your Diet
A baseline sample taken before a longevity diet gives you a comparison point that a later “normal” result cannot replace. For most adults without active illness, repeat testing after 8-12 weeks is long enough to assess triglycerides and fasting glucose, while HbA1c needs about 90 days to reflect average glycaemia.
Try to standardise the boring details: use the same laboratory where possible, draw at a similar time of day, maintain usual hydration, and record new medicines, supplements, illness, alcohol intake, menstrual timing, and unusually hard training. A 10 km race the day before testing can raise AST, creatinine, white cells, and sometimes hs-CRP without reflecting your usual physiology.
For lipid and glucose comparisons, I often favour an 8-12 hour fast when triglycerides have been high or when insulin resistance is under review. Non-fasting lipids remain valid for routine cardiovascular assessment, but changing from a post-lunch draw to a fasting draw can manufacture an apparent triglyceride improvement. Our guide to before-and-after diet testing explains which markers move first.
Do not deliberately eat “perfectly” for 3 days before the first draw. A blood test based diet is useful only when it describes your real starting point. One exception is alcohol: avoiding it for 48-72 hours before a planned triglyceride or liver assessment can reduce short-term noise, provided you record that choice and make the next test comparable.
Prioritise ApoB and Non-HDL Cholesterol Over Total Cholesterol
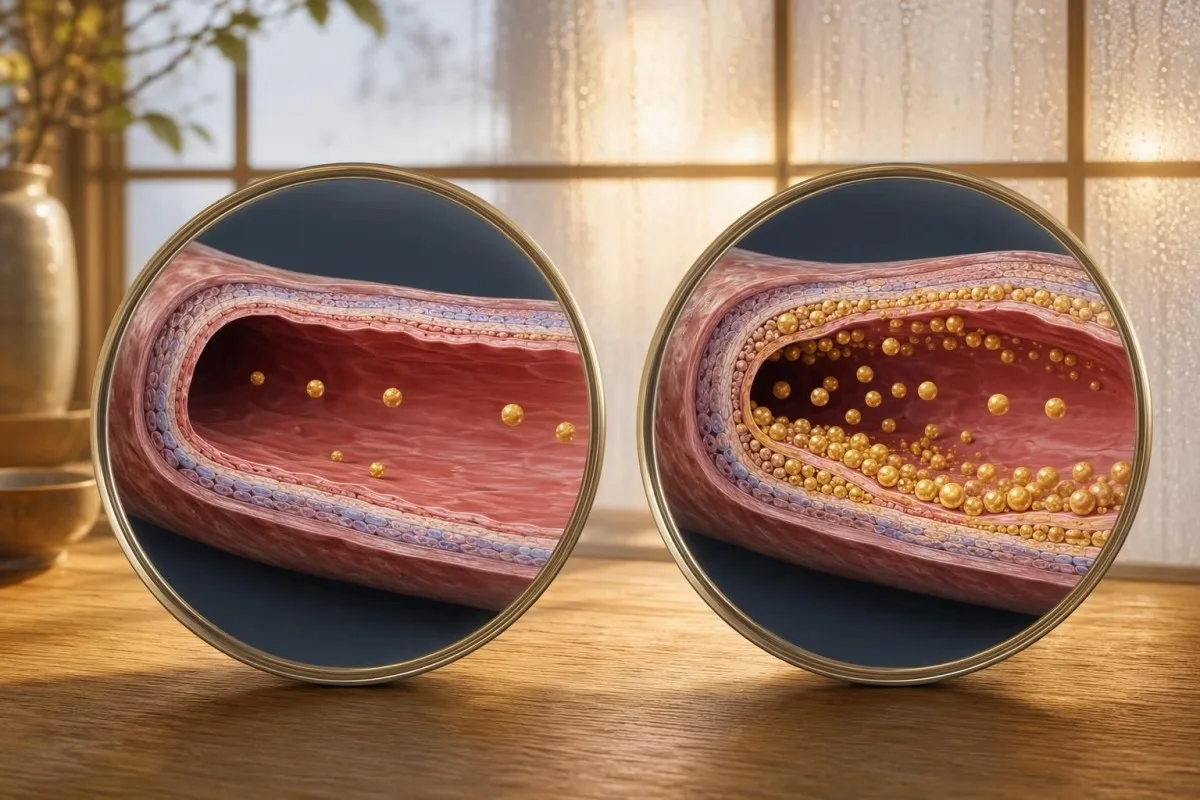
ApoB estimates the number of atherogenic particles, and non-HDL cholesterol estimates the cholesterol carried by them. For longevity-focused prevention, these are often more informative than total cholesterol or HDL alone, particularly when triglycerides are elevated.

An ApoB below 90 mg/dL is commonly reasonable for average-risk primary prevention, whereas ApoB of 130 mg/dL or above is a risk-enhancing factor in the 2018 AHA/ACC cholesterol guideline. LDL cholesterol of 190 mg/dL or above warrants medical assessment regardless of diet quality because inherited disorders become more likely. Grundy et al. (2019) emphasised that treatment targets depend on overall cardiovascular risk, not one universal “optimal” number.
Non-HDL cholesterol is simply total cholesterol minus HDL cholesterol, so it is available from an ordinary lipid panel. When triglycerides exceed 200 mg/dL, non-HDL and ApoB often describe residual particle burden more honestly than calculated LDL alone. For more detail on risk-based thresholds, see our review of LDL targets for men; the same principle applies to women, with different baseline risk considerations.
I see a recurring misunderstanding with high-fat dietary experiments: a triglyceride drop does not automatically cancel a large ApoB rise. If triglycerides fall from 160 to 70 mg/dL but ApoB rises from 88 to 142 mg/dL, that is not a clear longevity win. Discuss family history, blood pressure, smoking, diabetes, lipoprotein(a), and medication options with a clinician.
Use HbA1c and Glucose to Track Glycaemic Direction
HbA1c of 5.7-6.4% defines prediabetes, and 6.5% or higher can diagnose diabetes when confirmed appropriately. Fasting glucose of 100-125 mg/dL also indicates prediabetes, while 126 mg/dL or above needs confirmation in an asymptomatic person.

HbA1c represents glycation across the roughly 120-day life of red cells, but the most recent 30 days influence it disproportionately. A shift from 6.0% to 5.7% after 3 months may be clinically relevant, especially if fasting glucose and triglycerides improve too. The American Diabetes Association Professional Practice Committee (2025) recommends using accredited laboratory methods and confirming diagnostic results unless symptoms and marked hyperglycaemia make the diagnosis clear.
Fasting insulin can add context, but it is not standardised enough to treat a single result as a diagnosis. High fasting insulin with normal HbA1c can precede rising glucose, yet sleep loss, acute stress, and a high-carbohydrate meal the prior evening can alter it. If your A1c looks normal but triglycerides are high, our insulin resistance guide covers sensible next questions.
A caveat from practice: iron deficiency, haemolysis, recent blood loss, kidney disease, and some haemoglobin variants can make HbA1c read falsely high or low. In a patient with ferritin of 7 ng/mL and an unexplained A1c rise, I would not alter diet or medication without checking glucose readings or considering fructosamine. This is one of those areas where context matters more than a decimal point.
Treat hs-CRP as a Context Marker, Not an Aging Score
High-sensitivity C-reactive protein below 1 mg/L is generally considered lower cardiovascular risk, 1-3 mg/L average risk, and above 3 mg/L higher risk when the person is otherwise well. A result above 10 mg/L usually reflects an acute process or recent physical stress and should be repeated rather than interpreted as chronic dietary inflammation.

hs-CRP rises after respiratory infections, gum disease, autoimmune activity, obesity, sleep deprivation, and hard exercise; it does not identify the cause. I once reviewed a value of 12.4 mg/L in a keen cyclist who had completed a long event 36 hours earlier and had a painful molar. His repeat result 3 weeks later was 0.8 mg/L. Diet was not the explanation.
For an interpretable trend, wait at least 2 weeks after fever, injury, vaccination, or a demanding endurance event, and repeat hs-CRP twice if the result will influence cardiovascular decisions. Pair it with waist circumference, ApoB, blood pressure, and glucose rather than chasing anti-inflammatory supplements. The CRP-to-albumin ratio can be useful in selected ill patients but is not a general longevity target.
The evidence for lowering hs-CRP with a Mediterranean-style pattern is plausible but not cleanly separable from weight change, exercise, and smoking cessation. A decrease from 2.8 to 1.5 mg/L may be encouraging, but it is not proof that arterial risk has fallen by a predictable amount. Persistent values above 3 mg/L deserve a clinician’s review for cardiovascular and non-cardiovascular causes.
Monitor Kidney Function With eGFR, Creatinine, and Urine Albumin
An eGFR below 60 mL/min/1.73 m² for 3 months or longer can meet criteria for chronic kidney disease, and a urine albumin-creatinine ratio above 30 mg/g is abnormal. Kidney monitoring matters when a longevity diet is high in protein, includes creatine, or is paired with diabetes or hypertension.

Creatinine is influenced by muscle mass, cooked meat, creatine supplements, hydration, and intense exercise. A muscular 38-year-old taking 5 g of creatine daily may show creatinine of 1.3 mg/dL with a calculated eGFR near 70, yet have normal cystatin C and no urine albumin. That pattern is very different from a progressive eGFR decline with albuminuria.
The 2024 KDIGO guideline recommends confirming chronicity and considering cystatin C when creatinine-based eGFR may be inaccurate. A urine ACR below 30 mg/g is normal to mildly increased, 30-300 mg/g is moderately increased, and above 300 mg/g is severely increased. Our kidney albumin guide explains why urine testing adds information that a blood test alone misses.
Avoid interpreting a mildly higher creatinine after a high-protein dinner as dietary kidney damage. Instead, repeat under similar conditions and look at the slope over time. New ankle swelling, reduced urine output, breathlessness, or an abrupt eGFR fall needs timely medical evaluation rather than a nutrition experiment.
Check Nutrient Status When Dietary Restriction Raises Risk
Ferritin, vitamin B12, 25-hydroxyvitamin D, and sometimes iodine, zinc, or calcium-related tests are useful when a longevity diet excludes food groups. Broad micronutrient screening in everyone is not evidence-based; testing should follow the foods removed, symptoms, medicines, life stage, and previous results.

Ferritin below 15 ng/mL strongly supports depleted iron stores when there is no inflammatory illness, although many clinicians investigate symptomatic patients below 30 ng/mL. Ferritin is also an acute-phase reactant, so a result of 80 ng/mL alongside CRP of 18 mg/L does not reliably exclude iron restriction. Plant-based eaters, people with heavy periods, and frequent blood donors need particularly careful interpretation; our plant-based nutrient checklist is a practical starting point.
Vitamin B12 below about 200 pg/mL, or 148 pmol/L, raises concern for deficiency, but borderline results often need methylmalonic acid or homocysteine before treatment decisions. Serum folate can rise quickly after supplements and may hide a B12 problem, particularly when MCV is high. A vegan diet can be excellent for cardiometabolic health, but reliable B12 supplementation is non-negotiable.
For vitamin D, a 25-hydroxyvitamin D level of 20 ng/mL or higher meets the National Academy of Medicine threshold for most people’s skeletal health. Clinicians disagree about pursuing 30 ng/mL in healthy adults; the 2024 Endocrine Society guidance did not endorse a universal higher target for disease prevention. More is not better: repeated levels above 50-60 ng/mL should trigger a supplement-dose review.
Include Liver Enzymes and Protein Markers When the Pattern Changes
ALT, AST, GGT, alkaline phosphatase, bilirubin, albumin, and uric acid can reveal whether a dietary change is creating an unintended liver, alcohol, medication, or protein-balance signal. These tests are supportive clues, not direct measures of diet quality.

ALT reference limits vary by laboratory and sex, but a persistent increase above the laboratory upper limit deserves follow-up rather than a casual assumption of “detox.” Rapid weight loss can transiently increase ALT as liver fat flux changes, while resistance exercise can raise AST through muscle release. When AST is 89 IU/L and ALT is 31 IU/L after a hard lifting session, creatine kinase and timing often clarify the picture.
Albumin is often overinterpreted as a protein-intake score. The usual adult reference range is roughly 35-50 g/L, but albumin falls more often with inflammation, liver synthetic dysfunction, kidney loss, or fluid overload than with a few weeks of low protein intake. It changes slowly, which is why short-term dietary protein claims based on albumin are shaky.
Uric acid above 7 mg/dL in men or 6 mg/dL in women is common, but it does not diagnose gout on its own. Fructose-heavy drinks, alcohol, obesity, kidney function, genetics, and rapid ketosis can all matter. If a low-carbohydrate phase coincides with gout symptoms, review our uric acid testing plan with a prescriber rather than simply adding more water.
Track Blood Test Trends, Not One-Off Reference Flags
Your personal baseline can be more informative than a single reference-range flag when a marker changes steadily across three or more measurements. Reference intervals describe where 95% of a selected population falls; they do not automatically define your ideal result or explain a meaningful upward slope.

ApoB moving from 78 to 90 to 104 mg/dL over 18 months is worth discussing even if each laboratory result appears technically in range. The same applies to fasting glucose rising from 87 to 94 to 101 mg/dL. Small shifts can reflect biology, but a repeated direction is harder to dismiss than an isolated outlier.
Kantesti is an AI biomarker interpretation platform designed to place a new result beside earlier reports while preserving the original laboratory units and reference limits. Our longitudinal analysis guide explains why a 20% ferritin fall means something different after blood donation than it does with unexplained fatigue and no obvious loss.
Dr. Thomas Klein’s practical rule is to annotate every change: diet start date, weight change, training volume, new medication, supplement dose, sleep disruption, and illness. Without those notes, an impressive-looking graph can tell the wrong story. A trend is a prompt for clinical reasoning, not a verdict.
Choose Retest Timing That Matches the Marker
Most diet-driven lipid and fasting glucose changes can be reassessed after 8-12 weeks, while HbA1c needs about 3 months and iron stores may take 3-6 months to settle. Testing monthly usually creates expense and noise rather than a clearer longevity signal.
Triglycerides can change within days of reduced alcohol or refined carbohydrate intake, but that speed also makes them variable. LDL cholesterol and ApoB usually stabilise over several weeks after a sustained dietary shift. Ferritin can lag because replenishing stores takes time, especially if menstrual losses or gastrointestinal absorption problems continue.
Kantesti AI can compare uploaded reports in about 60 seconds, but a rapid interpretation cannot repair a poorly standardised specimen. If you are building a personal record, our trend analysis article recommends recording fast duration, exercise in the previous 48 hours, alcohol in the previous 72 hours, and all supplements taken that morning.
Biotin deserves special mention. Doses of 5,000-10,000 mcg found in some hair products can interfere with several immunoassays, including some thyroid and cardiac tests. Ask the laboratory or clinician how long to pause it; 48-72 hours is commonly suggested, but kidney function, dose, and assay design can alter that advice.
Match Your Lab Plan to the Diet You Actually Follow
Mediterranean-style, plant-forward, low-carbohydrate, and time-restricted diets can produce different laboratory trade-offs. A useful blood test based diet checks the marker most likely to worsen as well as the marker you hope will improve.
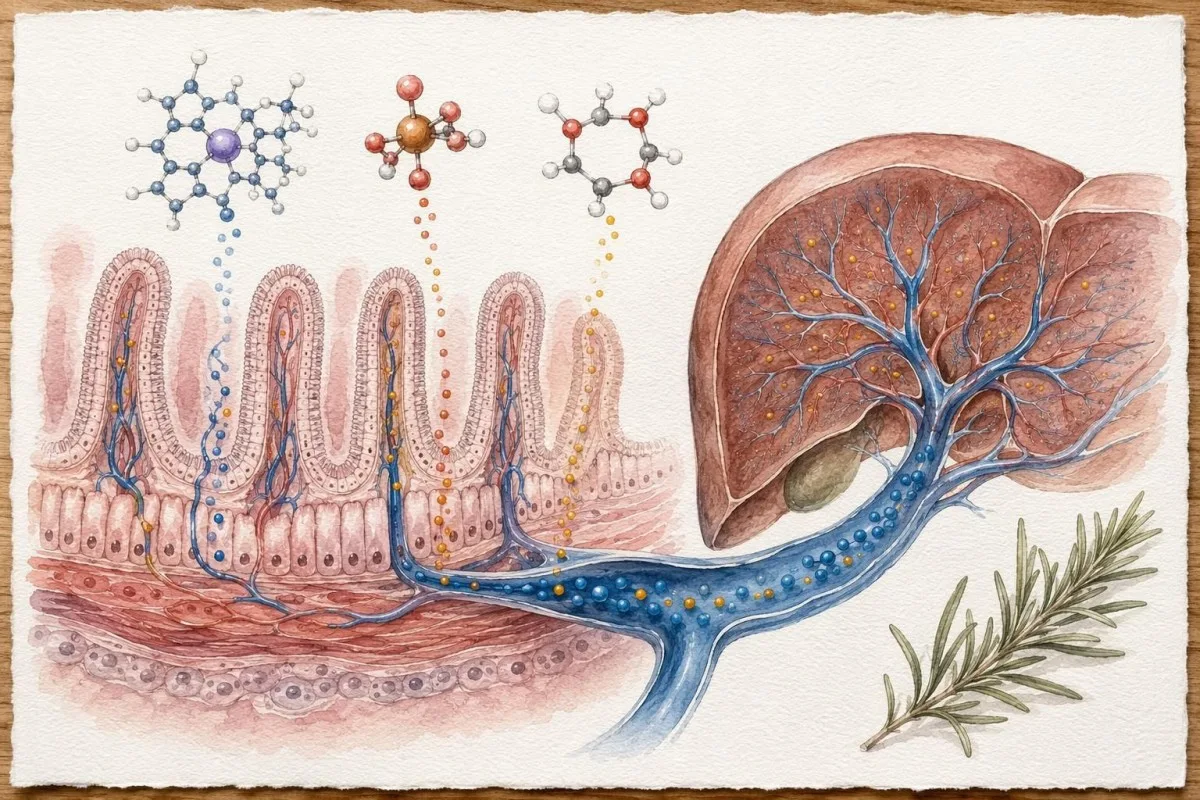
A Mediterranean-style pattern often improves triglycerides, non-HDL cholesterol, blood pressure, and glycaemic control, particularly when it replaces ultra-processed foods. The PREDIMED trial reported fewer major cardiovascular events with a Mediterranean diet supplemented with olive oil or nuts than a reduced-fat control diet in high-risk adults (Estruch et al., 2018). That is stronger evidence than any single nutrient’s marketing claim.
With vegan or mostly plant-based eating, monitor B12 and consider ferritin, vitamin D, iodine exposure, zinc, and calcium intake according to food pattern and life stage. With a low-carbohydrate or ketogenic pattern, watch ApoB, LDL cholesterol, uric acid, creatinine context, and electrolytes rather than assuming lower glucose settles the entire question. The Mediterranean diet marker guide helps prioritise the first follow-up panel.
Time-restricted eating can lower average caloric intake and improve some glucose measures, but it can also lead to low energy availability in athletes. In my experience, low ferritin, falling T3 during illness, missed periods, recurrent injuries, and a rising BUN-to-creatinine ratio are not trophies of disciplined fasting. They are reasons to reassess intake and training load.
Do Not Blame Every Abnormal Result on Food
Persistent abnormal laboratory results may reflect genetics, medication effects, endocrine disease, kidney disease, alcohol use, or acute illness rather than a longevity diet. Diet is influential, but it is not an all-purpose explanation.

LDL cholesterol of 220 mg/dL, especially with relatives who had early heart attacks, should raise the possibility of familial hypercholesterolaemia. A high-fibre diet may help, but it should not delay formal assessment. Likewise, a rising TSH, anaemia, or new protein in urine needs diagnostic work rather than a stricter nutrition plan.
Medication effects are common and surprisingly easy to miss. Statins can alter liver enzymes and glucose slightly, metformin can lower B12 over time, corticosteroids raise glucose and triglycerides, and diuretics can change sodium, potassium, and uric acid. Our AI report accuracy checklist includes the medication and unit checks I would want before acting on a flagged result.
Kantesti AI supports pattern recognition across laboratory reports, but it does not diagnose illness or replace a clinician who can examine you and review your medical record. A result that conflicts with how you feel, or a surprise result with major treatment implications, should be repeated or clinically verified. Lab errors, sample haemolysis, and transcription mistakes do happen.
Know Which Results Need Medical Review Instead of More Tracking
Triglycerides of 500 mg/dL or higher, confirmed glucose in the diabetic range, persistent eGFR below 60, urine ACR above 30 mg/g, or liver enzymes more than three times the upper limit merit clinician-led assessment. Tracking is useful only when it does not postpone necessary care.

Seek same-day medical advice for glucose of 200 mg/dL or higher with excessive thirst, vomiting, abdominal pain, drowsiness, or rapid breathing. Jaundice, very dark urine, pale stools, chest pain, new breathlessness, or markedly reduced urine output also need urgent assessment irrespective of a diet plan. Do not wait for a scheduled retest.
A more measured appointment is appropriate for ApoB above 130 mg/dL, LDL cholesterol above 190 mg/dL, HbA1c 5.7% or higher, recurrent hs-CRP above 3 mg/L, ferritin below 15 ng/mL, or a sustained fall in eGFR. Bring the original PDF reports rather than only screenshots; the units, collection dates, and reference intervals matter. Kantesti’s clinical validation approach is built around preserving that report-level context.
No AI output should encourage someone to stop prescribed lipid, diabetes, blood-pressure, thyroid, or kidney medication. Food can be powerful, but medication changes need a prescriber and follow-up testing. This is particularly true during pregnancy, breastfeeding, active cancer treatment, eating-disorder recovery, and advanced kidney or liver disease.
A Practical 12-Month Longevity Diet Lab Plan
A sensible first-year plan is a baseline panel, a standardised follow-up at 8-12 weeks, and a further review at 6-12 months if the results are stable. The plan should be narrowed or expanded according to age, family history, medication, symptoms, and the dietary restrictions you have chosen.

At baseline, consider a lipid panel with ApoB if available, HbA1c or fasting glucose, comprehensive metabolic panel, creatinine with eGFR, urine ACR when diabetes or hypertension risk is present, and nutrient tests guided by diet. At 8-12 weeks, repeat only the markers expected to move or those that were abnormal. This protects you from the false alarms that come with indiscriminate testing.
At 6-12 months, revisit cardiovascular risk, blood pressure, body composition, physical function, sleep, and family history alongside the lab trend. Kantesti is an AI-powered blood test analysis tool used across 127+ countries to organise multilingual laboratory reports, but the best use of any tool is a well-prepared conversation with a qualified clinician. Our Medical Advisory Board provides physician oversight for the clinical standards behind our interpretation approach.
Bottom line: use a longevity diet to improve durable risk factors, not to chase a laboratory identity. If eating is becoming anxious, rigid, socially isolating, or driven by fear of ordinary biological variation, pause and get support. The healthiest long-term plan is one you can nourish yourself with, enjoy, and sustain.
Frequently Asked Questions
What blood tests should I get for a longevity diet?
A practical longevity diet panel includes a lipid panel with ApoB or non-HDL cholesterol, triglycerides, HbA1c or fasting glucose, creatinine with eGFR, liver enzymes, and selected nutrient tests based on dietary restriction. ApoB below 90 mg/dL is a reasonable primary-prevention target for many adults, while HbA1c of 5.7-6.4% indicates prediabetes. Add urine albumin-creatinine ratio when diabetes, hypertension, kidney risk, or a high-protein diet is relevant. No blood test can prove longevity, so results should be used to track established health risks over time.
How often should I test blood markers after changing my diet?
Most people should repeat diet-sensitive lipids and fasting glucose after 8-12 weeks of a sustained dietary change. HbA1c needs about 3 months because it reflects average glucose exposure across red-cell lifespan, while ferritin may need 3-6 months to show stable replenishment. Monthly testing is usually too frequent and magnifies ordinary variation from exercise, illness, fasting duration, alcohol, and hydration. Use the same laboratory and similar preparation for the most interpretable comparison.
Is ApoB more useful than LDL cholesterol for longevity?
ApoB is often more useful than LDL cholesterol when triglycerides are elevated, insulin resistance is present, or LDL and non-HDL cholesterol disagree. ApoB estimates the number of atherogenic lipoprotein particles, and an ApoB of 130 mg/dL or higher is an ACC risk-enhancing factor. LDL cholesterol still matters: an LDL result of 190 mg/dL or higher warrants clinical assessment even if triglycerides are low. The best choice depends on total cardiovascular risk, family history, blood pressure, diabetes status, and lipoprotein(a).
Can a healthy diet lower hs-CRP?
A diet rich in minimally processed plant foods, unsaturated fats, and fibre may lower hs-CRP, especially when it supports weight loss and better glucose control, but hs-CRP is not a direct diet score. Values below 1 mg/L are generally lower cardiovascular risk, 1-3 mg/L average risk, and above 3 mg/L higher risk when acute illness is absent. An hs-CRP result above 10 mg/L should generally be repeated after at least 2 weeks because infection, dental disease, injury, and hard exercise can cause temporary elevation. Persistent elevation needs clinician-led evaluation rather than supplement shopping.
Which nutrient tests matter on a plant-based longevity diet?
Vitamin B12 and ferritin are the highest-yield nutrient tests for many people following a fully plant-based longevity diet, with 25-hydroxyvitamin D, iodine exposure, zinc, and calcium intake considered case by case. Vitamin B12 below about 200 pg/mL or 148 pmol/L raises concern for deficiency, while ferritin below 15 ng/mL strongly supports depleted iron stores when inflammation is absent. A normal ferritin does not always exclude iron restriction if CRP is elevated. Reliable B12 supplementation is generally needed for vegan diets regardless of how otherwise nutrient-dense the food pattern is.
Can exercise or supplements distort longevity blood markers?
Yes, vigorous exercise can temporarily raise AST, creatinine, creatine kinase, white cells, and hs-CRP for 24-72 hours, while creatine supplements can increase serum creatinine without proving kidney damage. Biotin doses of 5,000-10,000 mcg can interfere with some immunoassays, including certain thyroid and cardiac tests. A hard workout, dehydration, and a high-meat meal before testing can also alter short-term results. Record these exposures and repeat unexpected abnormalities under standardised conditions before changing a healthy diet or prescribed treatment.
Should I measure lipoprotein(a) if I am already tracking ApoB?
Consider a one-time lipoprotein(a), or Lp(a), measurement, especially with early heart disease or high cholesterol in close relatives. Lp(a) is largely inherited and usually changes little with diet, but a high result can support tighter ApoB and overall cardiovascular risk management.
Get AI-Powered Blood Test Analysis Today
Join over 2 million users worldwide who trust Kantesti for instant, accurate lab test analysis. Upload your blood test results and receive comprehensive interpretation of 15,000+ biomarkers in seconds.
📚 Referenced Research Publications
Klein, T., Mitchell, S., & Weber, H. (2026). Kantesti AI. (2026). RDW Blood Test: Complete Guide to RDW-CV, MCV & MCHC. Zenodo.. Kantesti AI Medical Research.
Klein, T., Mitchell, S., & Weber, H. (2026). Kantesti AI. (2026). BUN/Creatinine Ratio Explained: Kidney Function Test Guide. Zenodo.. Kantesti AI Medical Research.
📖 External Medical References
American Diabetes Association Professional Practice Committee (2025). 2. Diagnosis and Classification of Diabetes: Standards of Care in Diabetes—2025. Diabetes Care.






⚕️ Medical Disclaimer
This article is for educational purposes only and does not constitute medical advice. Always consult a qualified healthcare provider for diagnosis and treatment decisions.
E-E-A-T Trust Signals
Experience
Physician-led clinical review of lab interpretation workflows.
Expertise
Laboratory medicine focus on how biomarkers behave in clinical context.
Authoritativeness
Written by Dr. Thomas Klein with review by Dr. Sarah Mitchell and Prof. Dr. Hans Weber.
Trustworthiness
Evidence-based interpretation with clear follow-up pathways to reduce alarm.