
Biological age guide · Updated October 2026
Biological Age Calculator AI | Your Biological Blood Age from a Standard Blood Test
Your biological blood age is an estimate of how your body is aging, read from the markers in a routine blood test. Kantesti works it out automatically in every AI blood test interpretation, so there is nothing extra to order and no long questionnaire to fill in. This guide shows the number inside a real report, explains how it is calculated, and covers the blood markers that move it.
Short answer
A biological age calculator turns blood test results into an age in years. Kantesti's AI biological age calculator is built into every blood test interpretation. When your panel includes the nine markers of the published PhenoAge formula (albumin, creatinine, glucose, CRP, lymphocyte %, MCV, RDW, alkaline phosphatase and white blood cells), Kantesti uses that formula. When some are missing, the AI estimates your biological blood age from every value in the report plus your age, and the report names the method. Either way you see the markers that shaped the number. It is an educational estimate for tracking and for talking to your doctor, not a diagnosis.
What Biological Blood Age Looks Like in a Real Kantesti Report
This is the Biological Blood Age section from a real Kantesti report, anonymized and shown in English. The user was 60. Their blood age came out at 65, five years older than the calendar says. Below it sits the Hidden Indices panel, which calculates clinical ratios that a lab print-out leaves out.
Your blood age65Your age 60
Biological Blood Age AI
5 years older than your age
Biological age read by AI across your whole blood test
What shaped your number
- HOMA index slightly high
- ACTH high
- FSH (post-menopause) slightly high
What this means for you
Your blood age is 65, five years above your real age. This result is not final and can improve. Your report shows a slight rise in ACTH and cortisol, along with raised triglycerides (hypertriglyceridemia). These points are worth discussing with your doctor.
Your white blood cell (leukocyte) count is stable and contributes to your blood age.
Estimated by AI from all the values in this report and your age. The fewer markers a panel contains, the more indicative the figure.
Hidden Indices
Ratios and clinical scores calculated from your values that the lab print-out does not show
TyG index
High9.17
Insulin resistance marker calculated from triglycerides and glucose.
ln(TG × Glu ÷ 2), mg/dLPancreas & blood sugar
FromTriglycerides, fasting glucose
TG/
BorderlineHDL ratio 3.54
Marker of small, dense LDL particles and insulin resistance.
TG ÷ HDL, mg/dLHeart & blood vessels
FromTriglycerides, HDL cholesterol
Atherogenic index of plasma
Borderline0.19
log(TG/HDL). The higher the value, the more atherogenic the lipid profile.
log₁₀(TG ÷ HDL), mmol/LHeart & blood vessels
FromTriglycerides, HDL cholesterol
Remnant cholesterol
Borderline32mg/dL
Cholesterol carried by triglyceride-rich particles, linked to cardiac risk.
TC − HDL − LDLHeart & blood vessels
FromTotal cholesterol, HDL, calculated LDL
Total/
In rangeHDL cholesterol ratio 2.44
Castelli risk index for cardiovascular risk.
TC ÷ HDLHeart & blood vessels
FromTotal cholesterol, HDL cholesterol
Estimated average glucose
In range111mg/dL · 6.2 mmol/L
Your average blood glucose over about three months, derived from HbA1c.
28.7 × HbA1c − 46.7Pancreas & blood sugar
FromHbA1c (NGSP)
FIB-4 liver fibrosis score
In range1.25
Likelihood of advanced liver fibrosis from age, AST, ALT and platelets.
FIB-4 · Sterling 2006Liver
FromAST, ALT, platelets
Anion gap
In range12mmol/L
Acid-base screening from sodium, chloride and bicarbonate.
Na − (Cl + HCO₃)Kidneys & electrolytes
FromSodium, chloride, bicarbonate
BUN/
In rangecreatinine ratio 15.4
High values can point to dehydration or reduced blood flow to the kidneys.
BUN ÷ CrKidneys & electrolytes
FromUrea, creatinine
Neutrophil/
In rangelymphocyte ratio 1.04
Simple marker of systemic inflammation and physiological stress.
NEU ÷ LYMImmune system & inflammation
FromNeutrophils (absolute), lymphocytes (absolute)
How to Read Each Part of the Module
- The blood age dial. Your biological blood age in large type, with your real age underneath. The marker on the ring shows where the result sits on a scale centered on your own age.
- The age gap. The badge at the top says how many years older or younger your blood age is. Research on biological age focuses on this gap rather than on the raw number.
- The scale bar. Your real age and your blood age side by side on a green to red band, so the size of the gap is clear at a glance.
- What shaped your number. The markers that pushed the estimate up or down. In this sample, HOMA-IR (an insulin resistance index), ACTH and FSH were raised.
- What this means for you. A plain-language summary, plus markers that were stable and supported the result, here the white blood cell count.
- The method note. It tells you how the number was produced. This sample was an AI estimate built from all the values in the report. When all nine PhenoAge markers are present, the published formula is used instead.
Hidden Indices | Clinical Ratios Your Lab Report Does Not Print
Most lab reports list single values. Kantesti also calculates up to 18 well-known ratios and scores from values already in your report, using published formulas, and shows the inputs behind each one. Examples include the TyG index, the TG/HDL ratio, the atherogenic index of plasma, remnant cholesterol, estimated average glucose, eGFR, FIB-4, the anion gap and the neutrophil-to-lymphocyte ratio.
Notice how the sample fits together. The flagged indices (TyG 9.17, TG/HDL 3.54, atherogenic index 0.19 and remnant cholesterol 32 mg/dL) point the same way as the blood age drivers, toward insulin resistance and triglyceride-rich blood fats. When the blood age and the Hidden Indices tell the same story, you know where to start.
Your own report works the same way. Upload a recent blood test to Kantesti. The free first analysis previews your Biological Blood Age, and a full report shows the number, its drivers and every Hidden Index your panel allows.
What Is Biological Blood Age?
Chronological age counts birthdays. Biological age tries to describe how far your body has actually moved along the aging process. A biological blood age does this with blood markers that change as we get older and that, in large population studies, track the risk of illness and death better than age alone.
The best-known blood-based measure is Phenotypic Age, usually called PhenoAge. Morgan Levine and colleagues built it from US national health survey data (NHANES), selecting the nine routine blood markers that, together with age, best predicted mortality [1]. In an independent NHANES IV cohort, each extra year of Phenotypic Age was linked to roughly a 9% higher risk of death from any cause, after accounting for chronological age [2]. An older approach, the Klemera-Doubal method, combines several biomarkers in a similar way [3], and both methods are available in open research toolkits [4].
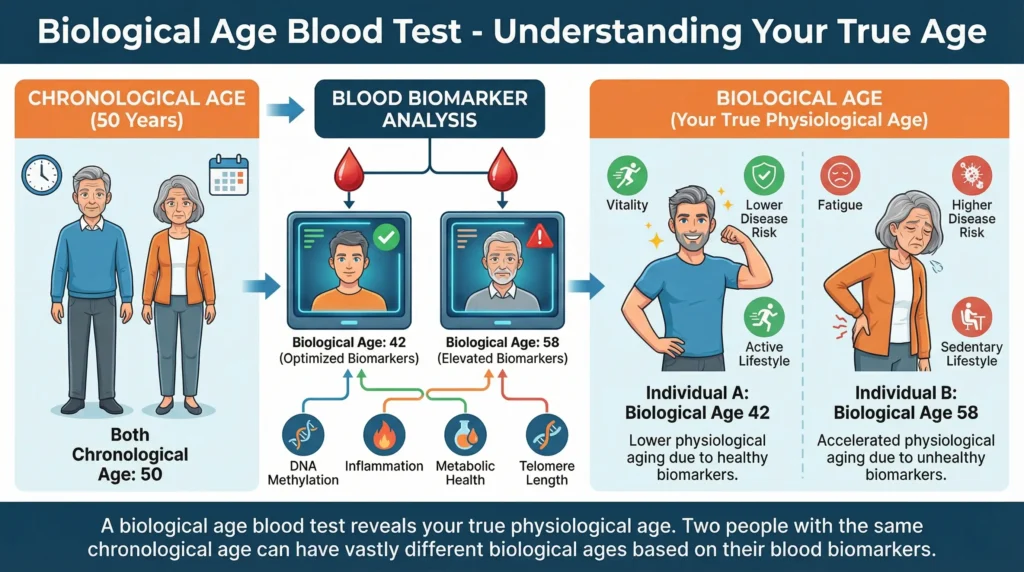
Chronological Age vs Biological Age
The two numbers answer different questions. Your chronological age is fixed by your date of birth. Your biological blood age is an estimate that can move between tests.

| Aspect | Chronological age | Biological blood age |
|---|---|---|
| What it measures | ChronologicalTime since you were born | BiologicalHow your blood markers compare with typical aging patterns |
| How it is worked out | ChronologicalYour date of birth | BiologicalA formula such as PhenoAge, or an AI estimate, applied to your results and your age |
| Can it go down? | ChronologicalNo | BiologicalYes, between tests |
| Health information | ChronologicalNone on its own | BiologicalIn research cohorts it adds risk information beyond age |
| Short-term swings | ChronologicalNone | BiologicalYes, with illness, hard exercise, fasting status and lab differences |
| Best use | ChronologicalRecords and eligibility | BiologicalTracking trends and preparing questions for your doctor |
Why Biological Age Drifts Away from Your Real Age
Genes play a part, but a smaller one than many people assume. A study of large family trees put the heritability of lifespan at well under 10% once couples' shared environment and partner choice were taken into account [11]. Most of the gap between biological and chronological age comes from factors that also show up in a blood test.
Metabolic health
Raised glucose, insulin resistance and high triglycerides are among the most common reasons a blood age comes out older.
Inflammation
Low-grade, long-lasting inflammation raises CRP and the white cell count, and both are PhenoAge inputs.
Organ reserve
Albumin, creatinine and alkaline phosphatase reflect how well the liver, kidneys and bones are coping.
Daily habits
Smoking, heavy drinking, inactivity and short sleep push several markers in the wrong direction at once.
Medicines and conditions
Some medicines and chronic conditions shift markers such as MCV, ALP or creatinine without saying much about aging itself.
Short-term noise
A cold, a hard workout, dehydration or a non-fasting sample can move a single result for days.
How the AI Biological Age Calculator Works
Kantesti's biological age calculator is not a separate tool you have to find. It runs inside the AI blood test interpretation every time you upload a report, alongside the explanation of each marker, the Body Map and the Hidden Indices.
Three Steps from Blood Test to Biological Blood Age
Upload your blood test
Add a lab report as PDF, JPG or PNG, or type your results in online. The AI reads each value, its unit and the reference range printed by your lab.
The engine picks the method
If all nine PhenoAge markers are present, it converts the units and applies the published formula. If not, it estimates your blood age from every value in the report plus your age.
Your report explains it
You see your blood age, the gap to your real age, the markers that shaped it and a plain-language summary, in your own language.
Formula Calculator vs AI Biological Age Calculator
Both rely on the same science. The differences are how much work you do, what happens when a marker is missing, and how much context you get with the result.
Manual formula calculators
- You type nine or more values in by hand
- Units must match exactly, for example g/L instead of g/dL
- One missing marker means no result at all
- You get a number with little explanation
Kantesti AI biological age calculator
- Values are read straight from your lab document
- Units are converted automatically
- PhenoAge when possible, a clearly labelled estimate when not
- Drivers, Hidden Indices and the Body Map explain the result
How Accurate Is a Biological Age Calculator?
Treat any biological age as an estimate, not a measurement. PhenoAge was designed to rank risk across large groups of people, and it does that well. For one person on one day, the result also carries everyday noise from the sample, the lab and how you were feeling when the blood was drawn.
Kantesti's Biological Blood Age follows the same logic. With all nine PhenoAge markers it uses the published formula. With fewer markers it becomes an AI estimate, and the fewer markers there are, the more indicative the figure. It is an educational estimate. It is not a clinical measurement of aging, and it does not diagnose, screen for or predict any disease.
When to read the number with extra care. A recent infection or injury (CRP can jump within a day), hard exercise in the 48 hours before the draw, dehydration, a non-fasting sample, pregnancy and some medicines can all shift single markers. If one of these applies, compare with your next test before drawing conclusions.
See your own biological blood age
Upload a blood test you already have. The free first analysis previews your Biological Blood Age, and a full report shows the number, the drivers and the Hidden Indices.
The Blood Markers Behind Your Biological Age
PhenoAge uses nine routine markers plus your age. Together they cover metabolism, inflammation, immunity, liver and kidney function, and how the bone marrow makes red blood cells. You can read more about each one in the Kantesti blood test biomarkers guide.
The 9 PhenoAge Biomarkers
Albumin
Older if lowerThe main blood protein, made by the liver. It reflects nutrition, liver function and inflammation.
Typical adult range3.5–5.0 g/dL (35–50 g/L)
Creatinine
Older if higherA waste product cleared by the kidneys. It also rises with muscle mass and with creatine supplements.
Typical adult rangeMen 0.7–1.3, women 0.6–1.1 mg/dL
Fasting glucose
Older if higherBlood sugar after at least 8 hours without food. 100 to 125 mg/dL is the prediabetes range.
Typical adult range70–99 mg/dL (3.9–5.5 mmol/L)
C-reactive protein (CRP)
Older if higherAn inflammation marker. The high-sensitivity test (hs-CRP) measures the low levels that matter here [13].
Lower-risk hs-CRPBelow 1 mg/L
Lymphocyte %
Older if lowerThe share of white blood cells that are lymphocytes, the cells behind adaptive immunity.
Typical adult rangeAbout 20–40%
Mean cell volume (MCV)
Older if higherThe average size of red blood cells. It rises with heavy drinking and with low vitamin B12 or folate.
Typical adult rangeAbout 80–100 fL
Red cell distribution width (RDW)
Older if higherHow much red cell size varies. Higher RDW is linked to higher mortality in large cohorts [12].
Typical adult rangeAbout 11.5–14.5%
Alkaline phosphatase (ALP)
Older if higherAn enzyme that comes mainly from the liver and bones.
Typical adult rangeAbout 40–130 U/L
White blood cell count (WBC)
Older if higherThe total number of immune cells. Counts that stay high-normal suggest ongoing immune activation.
Typical adult rangeAbout 4.0–11.0 × 10⁹/L
Ranges are typical adult values and vary by lab, sex and method. Always use the reference range printed on your own report. Glucose thresholds follow the American Diabetes Association [20].
Other Markers That Shape the AI Estimate
When the formula cannot be used, or when the report explains a result, the AI also weighs other markers your panel may contain.
- HbA1c and fasting insulin (HOMA-IR) for longer-term blood sugar control
- Triglycerides, HDL, LDL and non-HDL cholesterol for heart and blood vessels
- ALT, AST and GGT for liver health
- eGFR, urea and cystatin C for kidney function
- Ferritin, vitamin B12, folate and vitamin D for common deficiencies
- TSH and free T4 for thyroid function
- Hormones such as cortisol, ACTH, FSH, estradiol and testosterone, when they are tested
Tip. CRP is the PhenoAge marker most often missing, because it is not part of a standard blood count or metabolic panel. If you want a formula-based result, ask for hs-CRP alongside your usual tests, and make sure your blood count includes a differential, which gives the lymphocyte percentage.
Which Blood Tests to Ask For (A Practical Longevity Panel)
You do not need a specialist longevity test to get a biological blood age. Most of the markers come from two routine panels that many people already have once a year.
Complete blood count (CBC) with differential
- White blood cell count
- Lymphocyte % (needs the differential)
- Mean cell volume (MCV)
- Red cell distribution width (RDW)
- Neutrophils, hemoglobin and platelets
Comprehensive metabolic panel (CMP)
- Fasting glucose
- Creatinine and eGFR
- Albumin
- Alkaline phosphatase, ALT and AST
- Sodium, chloride, bicarbonate and urea
Worth adding
- hs-CRP, which completes the PhenoAge set
- HbA1c
- Lipid panel (total, HDL and LDL cholesterol, triglycerides)
- Fasting insulin, for HOMA-IR
- Ferritin, vitamin D, vitamin B12 and TSH
How to Get Comparable Results Each Time
- Use the same lab when you can, because methods and reference ranges differ between labs.
- Book a morning appointment after 8 to 12 hours of fasting if glucose or lipids are included.
- Skip hard training for 24 to 48 hours beforehand.
- Postpone the test if you have a cold, an infection or a recent injury.
- Drink water as usual and take your regular medicines unless your doctor says otherwise.
- Keep every PDF so you can upload and compare reports later.
How Often to Check Your Biological Blood Age
| Your situation | Suggested interval | Why |
|---|---|---|
| Routine health check | IntervalAbout once a year | WhyMatches most annual check-ups |
| You have changed your diet, exercise or weight | IntervalAfter about 3 months | WhyHbA1c reflects roughly three months, and red blood cells live for about 120 days |
| You are being treated for a condition | IntervalAs your doctor schedules | WhyYour care plan comes first |
Agree on how often to test with your doctor, especially if you have a health condition or take regular medicines.
How to Lower Your Biological Blood Age
Because PhenoAge is built from everyday markers, habits that improve those markers can also lower the number. The best evidence is for changes that improve blood sugar, blood fats, inflammation and fitness. Expect gradual shifts over months. Claims of a decade reversed in a few weeks are not backed by good evidence.
Changes with the Best Evidence
- Biggest lever
Move every day and build strength
Aim for 150 to 300 minutes of moderate activity a week plus muscle strengthening on two or more days, as the WHO recommends [19]. Exercise improves insulin sensitivity, triglycerides and CRP.
Eat a Mediterranean-style diet
Vegetables, legumes, whole grains, olive oil, nuts and fish, with fewer refined carbohydrates and sugary drinks. In the CALERIE trial, two years of moderate calorie restriction slowed the DunedinPACE aging clock by about 2 to 3% [9].
Protect your sleep
Most adults need at least 7 hours a night. Short sleep is linked to higher inflammatory markers and poorer blood sugar control.
✏️ Editor's Note (September 2026): Discuss persistently abnormal individual results with your clinician, because treating a specific risk factor matters more than improving a single composite score. — Dr. Thomas Klein, CMOStop smoking and keep alcohol low
Smoking is one of the strongest accelerators in aging-clock research. Alcohol raises triglycerides and GGT and enlarges red cells, which raises MCV, a PhenoAge input.
Bring your waist size down
Losing excess weight, especially around the waist, tends to lower glucose, insulin, triglycerides and CRP together.
Use supplements to fix proven gaps
Test first, then correct real deficiencies such as vitamin D, B12 or iron with your doctor. In the DO-HEALTH trial, omega-3 slowed several DNA-methylation aging clocks by up to about four months over three years [10].
Worked Example | What Could Move a Blood Age of 65 at Age 60
Based on the sample report above
Starting point. Real age 60, biological blood age 65. Drivers were HOMA-IR slightly high, ACTH high and FSH slightly high after menopause. Hidden Indices showed a high TyG index (9.17) and borderline TG/HDL ratio (3.54), atherogenic index (0.19) and remnant cholesterol (32 mg/dL).
The metabolic thread. Every metabolic flag points to insulin resistance and triglyceride-rich blood fats [15][16]. The levers most likely to move them are regular exercise, fewer refined carbohydrates and sugary drinks, less alcohol and losing excess weight around the waist [14].
The hormone thread. Hormone results need a doctor. ACTH and cortisol can rise with stress, poor sleep or medical causes that need proper assessment, and FSH is naturally high after menopause. Neither is something to fix with lifestyle changes alone.
The plan. Discuss the hormone results with a doctor, work on the metabolic markers, and repeat the same panel at the same lab after about three months. A lower TyG index and TG/HDL ratio would be the first signs that the blood age is likely to follow.
Educational example, not medical adviceTracking Your Biological Age Over Time
One biological age result is a snapshot. Several results taken under similar conditions show a direction, and the direction is what matters most.
What to Track in Each Report
Biological blood age
The headline number from each report.
Age gap
Blood age minus real age. A negative gap means younger than your years.
Drivers
Which markers pushed the result up or down this time.
Hidden Indices
Ratios such as TyG, TG/HDL and eGFR often move before the headline number does.
How to Read the Trend
Falling
Your changes are probably working. Note what you did differently and keep it up.
Stable
A blood age at or below your real age that holds steady is a good result in itself.
Rising
Check for short-term causes first, such as illness or a non-fasting sample. If the rise repeats, review it with your doctor.
Kantesti's Trend Analysis reviews all of your interpreted blood tests and charts each marker over time, and Blood Test Comparison puts two reports side by side so you can see exactly what changed.
Compare like with like. Small changes between two tests are often normal variation. Look for a direction that repeats across several tests taken at the same lab, at the same time of day and under the same fasting conditions.
Biological Blood Age vs Epigenetic Age Tests
Epigenetic clocks such as the Horvath clock, GrimAge and DunedinPACE read chemical tags on your DNA (DNA methylation), usually from a blood or saliva kit [5][6][7]. Blood-chemistry clocks such as PhenoAge read routine lab markers instead. Both predict health outcomes in research, but they measure different layers of aging, so the two numbers often disagree for the same person [8].
| Feature | Biological blood age | Epigenetic age test |
|---|---|---|
| What it reads | Blood ageRoutine blood chemistry and blood count | EpigeneticDNA methylation at selected sites |
| Sample | Blood ageStandard blood draw | EpigeneticBlood or saliva kit |
| Typical cost | Blood ageThe routine tests you may already have | EpigeneticUsually a few hundred US dollars per test |
| Turnaround | Blood ageAs soon as your lab results are ready | EpigeneticUsually several weeks |
| How fast it responds | Blood ageWeeks to months, as markers change | EpigeneticSlower, usually months |
| What you can act on | Blood ageSpecific markers to work on | EpigeneticA single score that is harder to act on |
| Main weakness | Blood ageSensitive to short-term illness and lab differences | EpigeneticCost, and results can vary between labs and kits |
Which Test Suits You?
A biological blood age suits you if
- You already have routine blood tests
- You want to see which markers to improve
- You want to re-check every few months at low cost
- You want the result explained in plain language
Consider an epigenetic test if
- You are taking part in a research study
- You want a second, slower-moving measure once a year
- You are comparing aging interventions over long periods
Genetic tests are different again. Your DNA sequence does not change with age. Kantesti's DNA test interpretation reads genetic variants from consumer DNA files, which adds context about inherited risk, but it does not measure biological age.
Biological Age Calculator FAQ
How do I calculate my biological age from a blood test?
You need your blood results and your age. With all nine PhenoAge markers you can use the published formula. The easier route is to upload your report to an AI biological age calculator such as Kantesti, which reads the values, converts the units, chooses the method and explains which markers shaped your result.
What is biological blood age?
It is an estimate of your biological age calculated from the biomarker values in your blood test and your age. Kantesti uses the published PhenoAge formula when your panel includes the nine markers it needs, and otherwise an AI estimate whose method the report names. It is educational and is not a clinical measurement of aging.
Is an AI biological age calculator accurate?
It is only as good as the data it receives. With a full PhenoAge panel, the result follows a formula tested in large population studies. With fewer markers it is a rougher estimate. In both cases single results move with everyday factors, so trends across several tests mean more than one number.
What is a good biological age?
A biological age at or below your chronological age is a good result. In research, people whose biological age runs several years ahead of their real age have higher health risks on average. For you personally, the direction over time matters more than any single value.
Can I lower my biological age?
Often, yes. Improving blood sugar, triglycerides, inflammation and fitness tends to improve the markers behind biological age. Trials such as CALERIE and DO-HEALTH show real but modest effects, so think in months rather than weeks.
Which blood markers matter most for biological age?
The nine PhenoAge markers are albumin, creatinine, fasting glucose, CRP, lymphocyte percentage, MCV, RDW, alkaline phosphatase and white blood cell count. CRP is the one most often missing from routine check-ups.
Is the Kantesti biological age calculator free?
Your first Kantesti analysis is free and needs no credit card, and it previews the Biological Blood Age. Full reports show the complete section with its drivers and Hidden Indices. The calculator is not a separate add-on. It comes with the AI blood test interpretation.
How often should I check my biological blood age?
Once a year is enough for most adults. If you are changing your diet, exercise or weight, re-test after about three months so the markers have time to respond.
Key Takeaways
It is built into every report
Your biological blood age comes with the Kantesti AI blood test interpretation. There is nothing extra to order.
Formula first, AI when needed
Kantesti uses the published PhenoAge formula when all nine markers are present, and a clearly labelled AI estimate when they are not.
Ask for hs-CRP
It is the PhenoAge marker most often missing from routine panels.
The drivers matter more than the number
The report shows which markers shaped your result, and the Hidden Indices often explain why.
Trends beat single tests
Re-test under the same conditions and look for a direction that repeats.
Educational, not diagnostic
Use the result to prepare questions for your doctor, not to diagnose yourself.
Find out your biological blood age
Upload a blood test you already have. Your report includes the Biological Blood Age, the markers behind it, the Body Map and the Hidden Indices, in more than 75 languages.
First analysis free · No credit card · Educational use only
About This Guide
Julian Emirhan Bulut
Founder and CEO, Kantesti Ltd
"People already have blood tests sitting in a drawer. We added the biological blood age to every report so they can see what those numbers say about how they are aging, explained plainly and with the limits stated just as plainly."
Julian Emirhan Bulut founded Kantesti and leads Kantesti Ltd, the London-registered company behind the Kantesti AI blood test analyzer. A software engineer by training, he oversees the product and the AI interpretation pipeline.
Medically reviewed by Thomas Klein, MD
Chief Medical Officer (CMO), Kantesti Ltd
Thomas Klein, MD, is Kantesti's Chief Medical Officer, with a clinical focus on hematology and laboratory medicine. He provides clinical oversight of Kantesti's interpretation methodology and reviewed this guide for medical accuracy on October 3, 2026.
- Reviewed
- Published
- Updated
Sources and References
This guide draws on peer-reviewed research and clinical guidelines. Kantesti's own methodology pages are listed after the references.
- Levine ME, Lu AT, Quach A, et al. An epigenetic biomarker of aging for lifespan and healthspan. Aging (Albany NY). 2018;10(4):573-591. doi:10.18632/aging.101414
- Liu Z, Kuo PL, Horvath S, Crimmins E, Ferrucci L, Levine M. A new aging measure captures morbidity and mortality risk across diverse subpopulations from NHANES IV. PLoS Medicine. 2018;15(12):e1002718. doi:10.1371/journal.pmed.1002718
- Klemera P, Doubal S. A new approach to the concept and computation of biological age. Mechanisms of Ageing and Development. 2006;127(3):240-248. doi:10.1016/j.mad.2005.10.004
- Kwon D, Belsky DW. A toolkit for quantification of biological age from blood chemistry and organ function test data (BioAge). GeroScience. 2021;43(6):2795-2808. doi:10.1007/s11357-021-00480-5
- Horvath S. DNA methylation age of human tissues and cell types. Genome Biology. 2013;14(10):R115. doi:10.1186/gb-2013-14-10-r115
- Lu AT, Quach A, Wilson JG, et al. DNA methylation GrimAge strongly predicts lifespan and healthspan. Aging (Albany NY). 2019;11(2):303-327. doi:10.18632/aging.101684
- Belsky DW, Caspi A, Corcoran DL, et al. DunedinPACE, a DNA methylation biomarker of the pace of aging. eLife. 2022;11:e73420. doi:10.7554/eLife.73420
- Moqri M, Herzog C, Poganik JR, et al. Biomarkers of aging for the identification and evaluation of longevity interventions. Cell. 2023;186(18):3758-3775. doi:10.1016/j.cell.2023.08.003
- Waziry R, Ryan CP, Corcoran DL, et al. Effect of long-term caloric restriction on DNA methylation measures of biological aging in healthy adults from the CALERIE trial. Nature Aging. 2023;3:248-257. doi:10.1038/s43587-022-00357-y
- Bischoff-Ferrari HA, Gängler S, Wieczorek M, et al. Individual and additive effects of vitamin D, omega-3 and exercise on DNA methylation clocks of biological aging in older adults from the DO-HEALTH trial. Nature Aging. 2025;5:376-385. doi:10.1038/s43587-024-00793-y
- Ruby JG, Wright KM, Rand KA, et al. Estimates of the heritability of human longevity are substantially inflated due to assortative mating. Genetics. 2018;210(3):1109-1124. doi:10.1534/genetics.118.301613
- Patel KV, Ferrucci L, Ershler WB, Longo DL, Guralnik JM. Red blood cell distribution width and the risk of death in middle-aged and older adults. Archives of Internal Medicine. 2009;169(5):515-523. doi:10.1001/archinternmed.2009.11
- Pearson TA, Mensah GA, Alexander RW, et al. Markers of inflammation and cardiovascular disease. Application to clinical and public health practice. Circulation. 2003;107(3):499-511. doi:10.1161/01.CIR.0000052939.59093.45
- Miller M, Stone NJ, Ballantyne C, et al. Triglycerides and cardiovascular disease. A scientific statement from the American Heart Association. Circulation. 2011;123(20):2292-2333. doi:10.1161/CIR.0b013e3182160726
- Simental-Mendía LE, Rodríguez-Morán M, Guerrero-Romero F. The product of fasting glucose and triglycerides as surrogate for identifying insulin resistance in apparently healthy subjects. Metabolic Syndrome and Related Disorders. 2008;6(4):299-304. doi:10.1089/met.2008.0034
- Dobiásová M, Frohlich J. The plasma parameter log (TG/HDL-C) as an atherogenic index. Clinical Biochemistry. 2001;34(7):583-588. doi:10.1016/S0009-9120(01)00263-6
- Nathan DM, Kuenen J, Borg R, et al. Translating the A1C assay into estimated average glucose values. Diabetes Care. 2008;31(8):1473-1478. doi:10.2337/dc08-0545
- Sterling RK, Lissen E, Clumeck N, et al. Development of a simple noninvasive index to predict significant fibrosis in patients with HIV/HCV coinfection. Hepatology. 2006;43(6):1317-1325. doi:10.1002/hep.21178
- World Health Organization. WHO guidelines on physical activity and sedentary behaviour. Geneva, 2020. who.int publication 9789240015128
- American Diabetes Association Professional Practice Committee. Standards of Care in Diabetes 2026, Diagnosis and Classification of Diabetes. Diabetes Care. 2026;49(Suppl 1). ADA Standards of Care
Conflict of interest. This guide is published by Kantesti Ltd, which offers the AI blood test interpretation described here. Thomas Klein, MD, is Kantesti's Chief Medical Officer. Medical statements were checked against the peer-reviewed sources listed above.
How this guide was made. The Kantesti editorial team prepared this update with AI-assisted drafting, and Thomas Klein, MD, reviewed it for medical accuracy on October 3, 2026. The sample report shown above is anonymized.
Medical disclaimer. This guide is for education and information only and is not medical advice. Kantesti provides informational support, is not a medical device and is not CE or UKCA marked. The Biological Blood Age is an educational estimate. It does not diagnose, screen for, monitor or predict any disease, health outcome or life expectancy. Always discuss your results, and any change to medicines, diet or exercise, with a qualified healthcare professional.