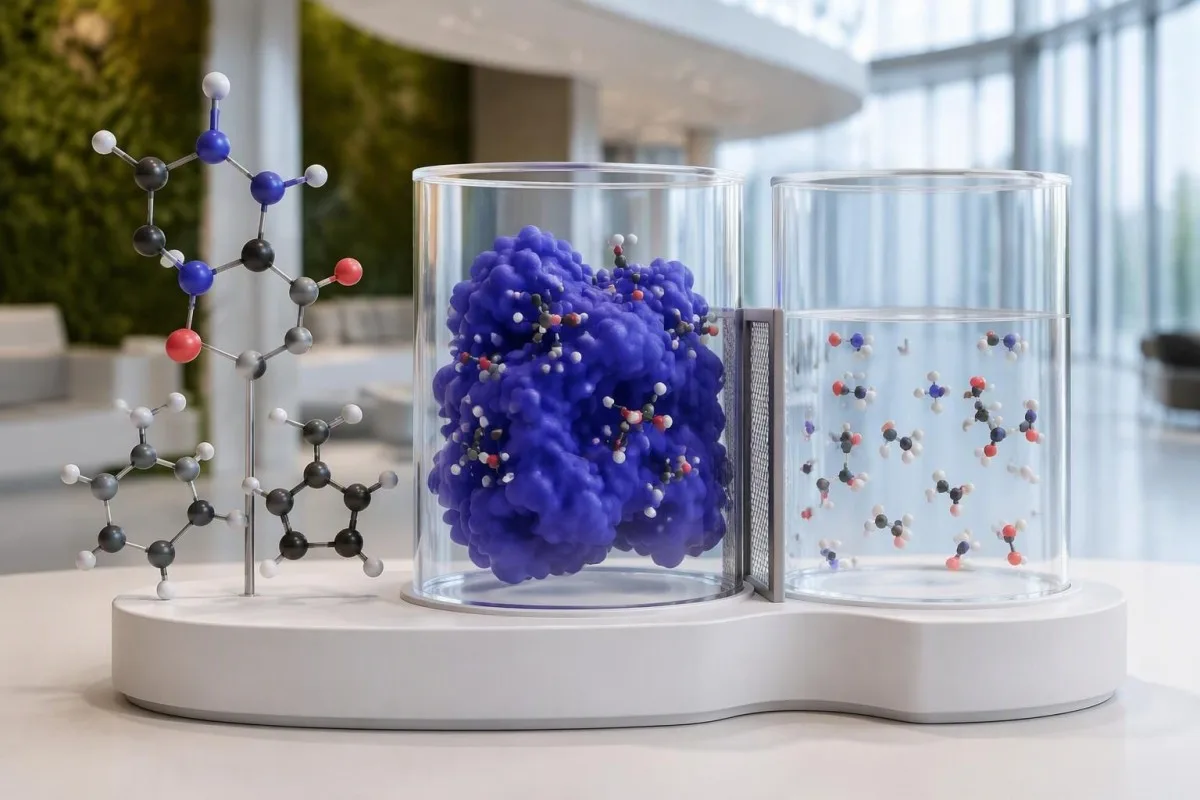
A total phenytoin concentration measures bound and unbound drug together. When protein binding changes, the number on the report may no longer reflect the concentration affecting the brain.


- Total phenytoin level commonly has a therapeutic reference range of 10–20 µg/mL, but this does not guarantee a safe free concentration.
- Free phenytoin level commonly has a therapeutic reference range of 1–2 µg/mL; values above 2 µg/mL need interpretation alongside symptoms and timing.
- Protein binding normally keeps approximately 90% of circulating phenytoin attached to proteins, mainly albumin.
- Low albumin below approximately 3.5 g/dL can make total concentrations misleading; the degree of distortion varies between patients.
- Kidney dysfunction can reduce protein binding through accumulated uremic substances, particularly when low albumin is also present.
- Interacting medicines such as valproate may change both binding and metabolism, making a total-to-free conversion unreliable.
- Sample timing for routine monitoring is usually immediately before the next scheduled dose; suspected toxicity should be assessed without waiting for a trough.
- Urgent symptoms include new unsteadiness, slurred speech, double vision or marked drowsiness; severe confusion, collapse or prolonged seizures require emergency care.
- Dose safety means contacting the prescriber for instructions, not independently reducing, skipping, doubling or stopping phenytoin.
Why can a normal total phenytoin level hide excess active drug?
A total phenytoin level can look acceptable while the free level is elevated because total testing combines protein-bound and unbound drug. Low albumin, uremia or interacting medicines can increase the unbound proportion, so a total result of 14 µg/mL might coexist with a free result above the usual 1–2 µg/mL range.
Approximately 90% of circulating phenytoin is protein-bound under typical conditions; the remaining fraction is available to enter tissues and produce therapeutic or adverse effects. That proportion is not fixed, and a report showing only total phenytoin cannot reveal whether an individual patient's free fraction is 10%, 15% or substantially higher.
Consider a hypothetical patient with a total concentration of 14 µg/mL and a free fraction of 20%: the free concentration would be 2.8 µg/mL. This arithmetic explains the apparent contradiction, but it is not a prediction from albumin alone—actual exposure also depends on clearance, recent dosing and when the sample was collected.
I’m Thomas Klein, MD, Chief Medical Officer at Kantesti LTD; my interpretation priority is the patient's neurological condition, not an isolated laboratory flag. Kantesti is an AI blood test analyzer that helps explain why a total result of 10–20 µg/mL may need additional context; our organizational background describes the company behind this educational service.
What do free and total phenytoin actually measure?
Total phenytoin measures bound plus unbound drug; free phenytoin measures only the unbound fraction. Albumin acts as a reversible carrier rather than permanently locking the medicine away, which is why the usual roughly 90% binding figure describes an equilibrium—not two completely separate stores.
Free phenytoin is the fraction most directly relevant to tissue exposure, including exposure in the nervous system. When free drug leaves the circulation, some bound drug dissociates to replace it; consequently, a 10% free fraction does not mean that only 10% of a prescribed dose ever has an effect.
A larger free fraction does not automatically produce a permanently higher free concentration, because unbound drug is also available for metabolism. The complication is phenytoin's capacity-limited clearance: reduced binding, impaired metabolism and an unchanged daily regimen can interact, so neither a 2-fold binding change nor a low albumin value predicts the eventual concentration by itself.
Albumin is often reported in g/dL or g/L, with 3.5 g/dL equivalent to 35 g/L. Total protein is not an adequate substitute, since globulins can keep total protein looking normal despite reduced albumin; our serum protein interpretation guide explains why these measurements answer different questions.
What is the phenytoin therapeutic range?
The commonly used phenytoin therapeutic range is 10–20 µg/mL for total drug and 1–2 µg/mL for free drug. These are treatment reference ranges, not guarantees of seizure control or freedom from toxicity; a patient's established effective concentration may sit outside them.
Laboratory units can create an avoidable misunderstanding: 1 µg/mL equals 1 mg/L. For phenytoin, 10–20 µg/mL is approximately 40–79 µmol/L, while 1–2 µg/mL free drug is approximately 4–8 µmol/L; comparing values without checking units can make an unchanged result appear several times higher.
A total result of 8 µg/mL is not automatically a reason to increase treatment if the patient is seizure-free and the free concentration is appropriate. Conversely, a total result of 18 µg/mL should not reassure someone with new ataxia and hypoalbuminemia; therapeutic drug monitoring should support an individualized clinical decision rather than replace it (Patsalos et al., 2018).
Kantesti AI distinguishes the meaning of a free result of 2.4 µg/mL from a total result with the same numerical value; those measurements are not interchangeable. Our explanation of out-of-range laboratory flags also addresses why a flagged value is a prompt for context, not an instruction to change medicine.
How does low albumin change a phenytoin level?
Low albumin reduces available binding capacity and can increase phenytoin's free fraction, making total concentrations less reliable. Albumin below approximately 3.5 g/dL is a common reason to consider altered binding, but there is no single albumin cutoff that proves toxicity or predicts the free level precisely.
A hypothetical 64-year-old recovering from severe illness might have albumin of 2.0 g/dL, total phenytoin of 14 µg/mL and measured free phenytoin of 2.8 µg/mL. The concerning finding is the elevated measured free concentration, especially with unsteadiness—not the albumin number alone, and not a calculated result presented as though it were measured.
Low albumin can reflect an acute inflammatory response, reduced liver synthesis, urinary protein loss, dilution or inadequate nutritional intake. A fall from 4.0 to 2.5 g/dL during hospitalization therefore deserves an explanation; simply telling the patient to eat more protein can miss the cause and does not provide a reliable way to correct phenytoin exposure.
Albumin trends and illness markers help explain why yesterday's binding conditions may differ from last month's, even if the prescription has not changed. The CRP and albumin relationship is useful background, although neither CRP nor an albumin-based ratio can determine whether free phenytoin is above 2 µg/mL.
Why does kidney dysfunction make total phenytoin misleading?
Kidney dysfunction can impair phenytoin binding through accumulated uremic substances, especially when albumin is also low. Phenytoin is mainly metabolized by the liver, so the problem is not simply that a lower eGFR prevents the kidneys from clearing unchanged medicine.
An eGFR of 25 mL/min/1.73 m² and albumin of 2.2 g/dL provide a stronger reason to question a total-only result than either finding viewed separately. No eGFR threshold reliably converts total to free phenytoin, because accumulated binding inhibitors, concurrent illness and the albumin concentration differ among people with similar kidney function.
Montgomery et al. examined 344 patients and found that the combination of hypoalbuminemia and kidney dysfunction particularly limited prediction of unbound phenytoin (Montgomery et al., 2019). Their findings also argue against assuming that every mild reduction in kidney function requires free testing when albumin is normal and a protein-binding displacer is absent.
BUN and creatinine describe different aspects of renal and metabolic physiology, not a direct measurement of phenytoin binding; our BUN and creatinine guide explains that distinction. If an eGFR of 25 accompanies new reduced urine output, confusion or worsening illness, the urgent kidney warning signs matter independently of the medication result.
Which interacting medicines affect free or total phenytoin?
Valproate can change phenytoin binding and metabolism, while medicines such as fluconazole, trimethoprim-sulfamethoxazole and amiodarone can raise exposure by inhibiting metabolism. There is no safe universal multiplier—for example, a 10 µg/mL total concentration cannot be converted reliably just because one interacting medicine is present.
Valproate is especially tricky because displacement can lower measured total phenytoin while its effects on metabolism can increase active exposure. The balance may evolve over several days, so a fall from 15 to 11 µg/mL does not necessarily mean the anticonvulsant effect has weakened; our valproate free-versus-total explanation covers the related binding problem.
Enzyme-inducing medicines, including carbamazepine and phenobarbital, can reduce phenytoin exposure in some circumstances, but interactions among antiseizure medicines are often bidirectional. Starting or stopping one medicine can therefore change more than one concentration; the carbamazepine monitoring principles help explain why the complete regimen must be reviewed.
A useful medication history covers at least the preceding 1–2 weeks, including new prescriptions, recently stopped medicines, nonprescription products and alcohol-pattern changes. The practical question is not only 'What do you take?' but 'What changed before the symptoms or laboratory change?'—and the pharmacist or prescriber should assess that timeline before giving dose instructions.
Why can phenytoin concentrations rise disproportionately?
Phenytoin metabolism becomes capacity-limited, so a small dose increase can produce a disproportionately large concentration increase. A 10% change in dose does not reliably produce a 10% change in level, particularly when exposure is already near the upper therapeutic range.
This is one reason phenytoin differs from medicines with more nearly linear pharmacokinetics: once metabolic capacity is approached, additional drug may be cleared much more slowly. A result rising from 16 to 24 µg/mL after a modest prescription change is pharmacologically plausible, but the clinician still needs to exclude timing differences, interactions and dispensing errors.
Formulation changes can also matter: phenytoin free acid and phenytoin sodium differ by approximately 8% in drug content. Capsules, suspension and injectable preparations are therefore not interchangeable simply because a package displays the same number of milligrams; the prescription and product formulation need professional reconciliation, not patient-led conversion.
Enteral nutrition can reduce phenytoin absorption, and stopping tube feeds can increase exposure despite an unchanged prescription; feed timing should be managed by the clinical team. Kantesti is an AI blood test interpretation platform that explains why a change from 16 to 24 µg/mL needs a timeline; our lamotrigine level interpretation illustrates why monitoring rules should not be transferred blindly between antiseizure medicines.
When should a phenytoin level sample be collected?
Routine phenytoin monitoring usually uses a trough sample collected immediately before the next scheduled dose. If toxicity is suspected, testing and clinical assessment should occur promptly rather than waiting several hours for an ideal trough; the sample's actual timing must then be documented.
For example, with a scheduled 09:00 dose, a collection at 08:45 may represent a trough if the preceding doses were taken as prescribed. A collection at 11:00 after that dose answers a different question; record both the last dose time and collection time instead of describing every morning sample as a trough.
Phenytoin testing itself does not generally require fasting, although another test ordered at the same appointment may have a fasting requirement. Patients should follow the agreed collection plan rather than independently skipping or delaying medicine; our first sample preparation checklist explains why medication instructions and dietary instructions need to be separated.
Comparing 2 results is most useful when dose timing, formulation and clinical circumstances are comparable. The exact waiting period used for a digoxin concentration sample should not be copied for phenytoin, because the medicines differ in absorption, distribution and the clinical purpose of monitoring.
How do steady state and loading doses affect interpretation?
A phenytoin result obtained soon after a dose change may not represent the eventual steady-state concentration. Many patients need roughly 7–10 days or longer to approach the new equilibrium, and accumulation can take 2–3 weeks when clearance is slow or concentrations are high.
A concentration obtained on day 3 after a prescription change can detect early accumulation without excluding a further rise by day 10. The commonly quoted average half-life of approximately 22 hours is not a dependable personal timetable: phenytoin's half-life lengthens as metabolism becomes saturated, so a fixed 'five half-lives' calculation can mislead.
Post-loading samples follow a different protocol, often around 2 hours after intravenous phenytoin or later after oral loading, depending on the clinical setting. Fosphenytoin adds an assay issue: its conversion and potential immunoassay interference mean samples are generally deferred until at least 2 hours after intravenous administration or 4 hours after intramuscular administration.
Specialist therapeutic drug monitoring guidance emphasizes that concentration interpretation depends on the question being asked, not just the reference interval (Patsalos et al., 2018). A maintenance trough should therefore not be compared casually with a post-loading result, just as the timing of tacrolimus troughs must remain tied to that medicine's specific dosing protocol.
When is a directly measured free phenytoin level useful?
Direct free-level measurement is particularly useful when altered binding or symptoms make total phenytoin unreliable. Common situations include albumin below approximately 3.5 g/dL, significant kidney dysfunction with hypoalbuminemia, critical illness, pregnancy, valproate use or neurological symptoms despite a total result of 10–20 µg/mL.
Whenever practical, free phenytoin, total phenytoin and albumin should describe the same collection episode. Pairing today's total result with last week's free result can produce a meaningless percentage if illness, dosing or protein binding changed between the samples; requesting a combined free-and-total test may help avoid that mismatch.
Laboratories typically separate unbound drug using ultrafiltration or equilibrium dialysis before measuring the concentration. Temperature, handling and the analytical method can affect the result, so a free value of 2.1 µg/mL should be interpreted against that laboratory's interval rather than treated as an exact biological boundary shared by every laboratory.
Kantesti AI can explain the distinction between a measured free result of 2.1 µg/mL and an albumin-adjusted estimate, but it cannot measure a missing free concentration from a PDF. Our report transcription checks address unit and label errors; our clinical methodology overview describes standards and limitations rather than replacing the treating clinician.
Can an albumin-corrected phenytoin calculation replace free testing?
An albumin-corrected phenytoin calculation estimates an adjusted total concentration; it does not directly measure free drug. One conventional equation divides total phenytoin by [(0.2 × albumin in g/dL) + 0.1], but its assumptions become unreliable in several of the patients who most need accurate interpretation.
Using that conventional equation, total phenytoin of 14 µg/mL with albumin of 2.0 g/dL yields an adjusted total of 28 µg/mL. That number is not the patient's measured total or measured free concentration; it is an estimate of what total exposure might resemble under the equation's assumed binding conditions.
Wilfred et al. studied 57 critically ill patients with hypoalbuminemia, finding that the Sheiner–Tozer approach classified free-level therapeutic categories correctly in approximately 73.7% of cases (Wilfred et al., 2022). That is useful performance for a rough estimate, but it leaves enough disagreement to matter when neurological symptoms or additional binding disturbances are present.
Equation variants use different coefficients, and severe kidney dysfunction or a displacing medicine can defeat the assumptions behind all of them. Unlike a standardized unit conversion such as 1 µg/mL to 1 mg/L, albumin correction is model-dependent; our corrected sodium calculation discussion offers another example of why a calculated result must remain clearly identified as an estimate.
Which toxicity symptoms need urgent assessment?
New unsteadiness, slurred speech, double vision, involuntary eye movements or unusual drowsiness warrant urgent assessment in someone taking phenytoin. Severe confusion, inability to walk safely, collapse or a seizure lasting 5 minutes require emergency care; a total result within 10–20 µg/mL does not rule out toxicity.
Neurological toxicity often becomes more likely as concentrations rise, but commonly quoted total-level symptom thresholds are only rough associations. Someone with albumin of 2.0 g/dL may develop symptoms at a total concentration that appears therapeutic, while another patient has no symptoms at a modestly elevated result; assess the person rather than waiting for a particular number.
Sudden speech changes or imbalance can also signal stroke, and marked drowsiness can reflect another medicine, low glucose or an electrolyte disorder. A sodium concentration of 120 mmol/L, for example, can itself cause neurological danger; our low sodium emergency clues explain why an apparently plausible medication explanation should not close the diagnostic process.
A new rash with fever, facial swelling or mouth sores can indicate a serious phenytoin reaction even when the free level is 1–2 µg/mL; these reactions are not simply concentration-related toxicity. Do not drive or manage suspected overdose alone, and obtain real-time instructions about the next dose; the overdose timing principles reinforce why urgent assessment cannot wait for a routine laboratory appointment.
What should you bring to the prescriber reviewing your result?
Bring the result, its units, dose and collection times, recent medication changes and current symptoms. These 5 information groups allow the prescriber to distinguish altered binding, accumulation, a mistimed sample and a reporting error without relying on the total phenytoin number alone.
A concise handover might read: 'Total 13 µg/mL, free 2.6 µg/mL, albumin 2.3 g/dL; sample collected before the scheduled dose; new antibiotic started 6 days ago; unsteady since yesterday.' That description is much more clinically useful than 'my level is normal,' and new neurological symptoms should trigger urgent contact rather than an ordinary future appointment.
Kantesti is an AI-powered blood test analysis tool that can help organize a total result of 13 µg/mL alongside albumin, kidney markers and a separately reported free result. Our technology explanation describes how report interpretation works; our medication trend analysis guide explains why comparable timestamps matter before calling a change meaningful.
My rule as Thomas Klein, MD, is to separate 3 questions: 'What was measured?', 'What changed?' and 'What is the patient experiencing?' Do not independently reduce, skip, double or stop phenytoin, because abrupt treatment changes can provoke seizures; if the next dose is due while toxicity is suspected, seek immediate individualized instructions from the treating service.
Research publications and the limits of the evidence
The evidence supports direct free phenytoin measurement when binding is altered, but it does not establish one universal testing schedule or toxicity cutoff. As of October 9, 2026, the 57-patient critical-care study and 344-patient prediction study cited here support contextual interpretation rather than automatic dose changes.
Wilfred et al. (2022) evaluated direct measurement against predictive approaches in critical illness; Montgomery et al. (2019) examined albumin and kidney-function effects across 344 patients. Neither study makes every out-of-range result an emergency or validates self-directed dosing, and the 2018 review by Patsalos et al. explains why therapeutic monitoring must remain linked to a clinical question.
Our 2 repository guides below are additional educational publications on different topics, not evidence for phenytoin ranges, correction equations or toxicity management. Kantesti's physician roles are described through our medical advisory board; a repository DOI provides a persistent identifier, but does not by itself establish peer review or a medication-management recommendation.
C3 C4 complement blood test & ANA titer guide. (n.d.). Zenodo. https://doi.org identifier: 10.5281/zenodo.18353989. The DOI link is provided in the publication list; ResearchGate title search and Academia.edu title search are discovery links, not confirmation of a hosted copy.
Nipah virus blood test: Early detection & diagnosis guide 2026. (n.d.). Zenodo. https://doi.org identifier: 10.5281/zenodo.18487418. The DOI link is provided in the publication list; ResearchGate publication search and Academia.edu publication search do not verify authorship, publication dates or peer-review status.
Frequently Asked Questions
Can a normal total phenytoin level still cause toxicity?
A total phenytoin level within the usual 10–20 µg/mL range can coexist with an elevated free concentration and toxicity. Low albumin, uremia and interacting medicines can increase the unbound proportion, making total testing misleading. A directly measured free level is particularly useful when symptoms and the total result disagree. New unsteadiness, slurred speech, double vision or marked drowsiness warrant urgent clinical assessment.
What is the normal free phenytoin level?
The commonly used free phenytoin therapeutic range is 1–2 µg/mL, equivalent to 1–2 mg/L. This is a treatment reference range rather than a guarantee of effectiveness or safety for every patient. A result above 2 µg/mL needs interpretation alongside symptoms, sample timing and the laboratory's own interval. Do not change the prescription without individualized instructions from the treating clinician.
Why does low albumin affect phenytoin levels?
Low albumin can increase the proportion of phenytoin that is unbound because fewer protein-binding sites are available. Approximately 90% of circulating phenytoin is normally protein-bound, but that proportion can change substantially during illness. Albumin below approximately 3.5 g/dL is a common reason to question a total-only result, although albumin alone cannot predict the free concentration accurately. Direct free testing may help when altered binding affects treatment decisions.
Does kidney disease raise the free phenytoin level?
Kidney dysfunction can increase phenytoin's free fraction through uremic substances that interfere with albumin binding. The problem is particularly relevant when kidney dysfunction and low albumin occur together, such as an eGFR of 25 mL/min/1.73 m² with albumin of 2.2 g/dL. Phenytoin is mainly metabolized by the liver, so reduced kidney filtration is not the whole explanation. A clinician may request direct free measurement when total concentrations are unreliable.
Should a phenytoin level be taken before or after the dose?
Routine phenytoin monitoring usually uses a trough sample collected immediately before the next scheduled dose. For a scheduled 09:00 dose, an 08:45 collection may represent a trough if prior doses were taken as prescribed. Suspected toxicity should be assessed promptly rather than waiting for a trough. Follow the agreed collection instructions and do not independently skip or delay medicine to prepare for testing.
Is corrected phenytoin the same as a measured free level?
An albumin-corrected phenytoin result is an estimate, not a directly measured free concentration. One conventional equation gives an adjusted total of 28 µg/mL when measured total phenytoin is 14 µg/mL and albumin is 2.0 g/dL. Kidney dysfunction, critical illness and displacing medicines can make such estimates inaccurate. Direct free testing is preferable when prediction uncertainty could change clinical management.
What should I do if my phenytoin level is high?
Contact the prescriber promptly for interpretation of a total result above 20 µg/mL or a free result above 2 µg/mL, using the laboratory's own alert instructions where supplied. New neurological symptoms warrant urgent assessment regardless of the number. Severe confusion, collapse, inability to walk safely or a seizure lasting 5 minutes require emergency care. Do not independently stop, reduce, skip or double phenytoin; obtain real-time instructions if the next dose is due.
Get AI-Powered Blood Test Analysis Today
Join over 2 million users worldwide who trust Kantesti for instant, accurate lab test analysis. Upload your blood test results and receive comprehensive interpretation of 15,000+ biomarkers in seconds.
📚 Referenced Research Publications
Klein, T., Mitchell, S., & Weber, H. (2026). C3 C4 Complement Blood Test & ANA Titer Guide. Kantesti AI Medical Research.
Klein, T., Mitchell, S., & Weber, H. (2026). Nipah Virus Blood Test: Early Detection & Diagnosis Guide 2026. Kantesti AI Medical Research.
📖 External Medical References
Patsalos PN et al. (2018). Therapeutic Drug Monitoring of Antiepileptic Drugs in Epilepsy: A 2018 Update. Therapeutic Drug Monitoring.
Montgomery MC et al. (2019). Predicting Unbound Phenytoin Concentrations: Effects of Albumin Concentration and Kidney Dysfunction. Pharmacotherapy.
Wilfred PM et al. (2022). Estimation of Free Phenytoin Concentration in Critically Ill Patients with Hypoalbuminemia: Direct-measurement vs Traditional Equations. Indian Journal of Critical Care Medicine.
⚕️ Medical Disclaimer
This article is for educational purposes only and does not constitute medical advice. Always consult a qualified healthcare provider for diagnosis and treatment decisions.
E-E-A-T Trust Signals
Experience
Physician-led clinical review of lab interpretation workflows.
Expertise
Laboratory medicine focus on how biomarkers behave in clinical context.
Authoritativeness
Written by Dr. Thomas Klein with review by Dr. Sarah Mitchell and Prof. Dr. Hans Weber.
Trustworthiness
Evidence-based interpretation with clear follow-up pathways to reduce alarm.