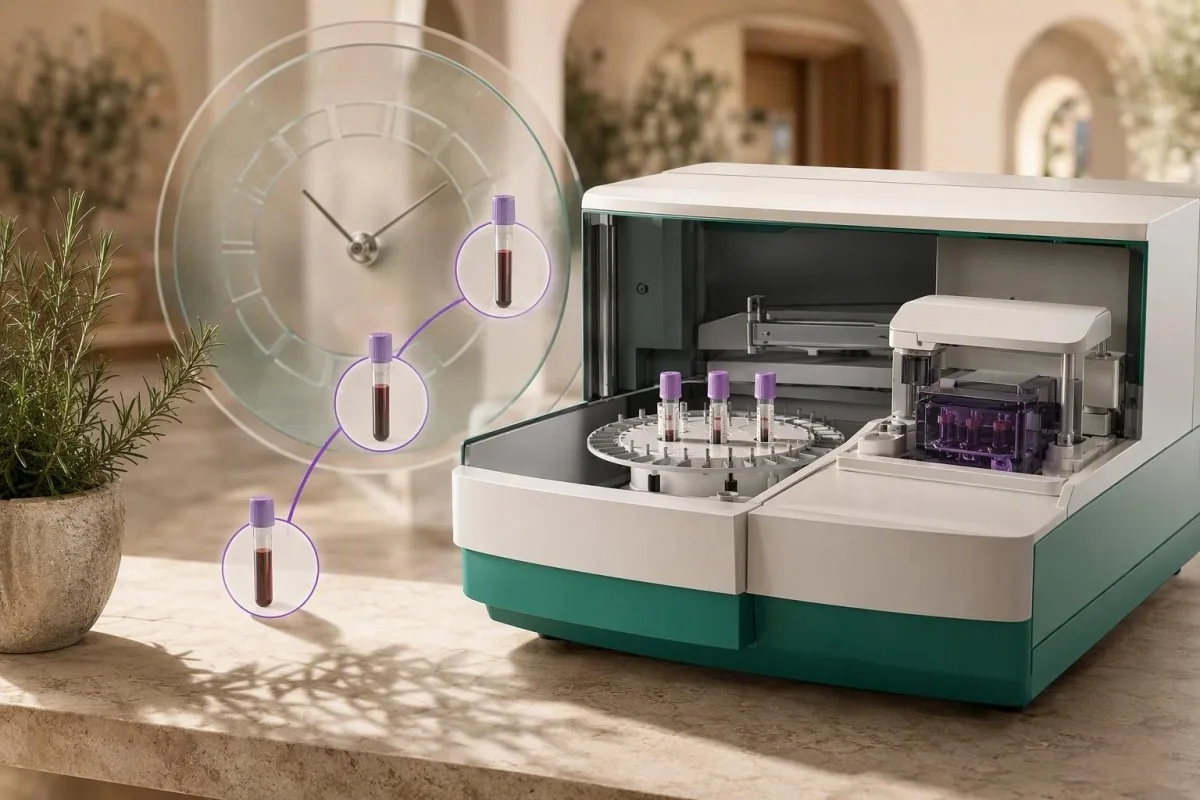
A changed result is not automatically a changed diagnosis. The timing of illness, meals, exercise, medicines, and the collection itself determines whether a repeat result reflects biology or noise.


- Comparable draw means the same lab, approximate time of day, fasting status, exercise exposure, and medication schedule whenever possible.
- Acute illness can raise CRP within 6–8 hours and suppress serum iron within 24 hours; repeat iron studies after recovery rather than treating one result alone.
- HbA1c reflects roughly the prior 8–12 weeks, so a result 10 days after a diet change cannot confirm that the change worked.
- Creatine kinase may remain elevated for 3–7 days after unfamiliar hard exercise; a CK above 5,000 IU/L with dark urine needs urgent assessment.
- Biotin interference can produce falsely low TSH and falsely high free T4 on some immunoassays; 5–10 mg/day supplements deserve a medication review before testing.
- LDL cholesterol usually needs 4–12 weeks after a sustained dietary or medication change before a follow-up result is clinically interpretable.
- eGFR requires persistence for at least 3 months before chronic kidney disease is diagnosed, unless other evidence of chronicity is already present.
- Trend direction is more informative than a single flag when the change exceeds expected biological and analytical variation.
How to tell whether a blood test difference between visits is real
A blood test difference between visits is most meaningful when the two samples were collected under similar conditions and the change is larger than normal biological variation. For most routine markers, I ask patients to compare the laboratory, collection time, fasting status, recent exercise, alcohol, illness, and medication timing before attaching a diagnosis to a new number.
The first question is not “is it flagged?” but “is the shift plausible for this marker?” A fasting glucose change from 92 to 101 mg/dL can follow sleep loss, a late meal, or ordinary within-person variation, whereas an HbA1c increase from 5.4% to 6.1% usually deserves confirmation because it represents a broader 8–12-week glycaemic exposure.
In my clinical work, a 52-year-old runner with AST 89 IU/L after a hilly race often has a very different story from a sedentary person with AST 89 IU/L, ALT 96 IU/L, and GGT 110 IU/L. The reason we worry about the second cluster is that liver-associated abnormalities travel together, while isolated post-exercise AST often settles over several days.
Kantesti is an AI blood test analyzer that compares dates, units, reference intervals, and co-moving biomarkers instead of treating each red flag as a separate problem. For a practical explanation of what constitutes a meaningful shift, see our guide to changes between lab visits.
The first 24 hours: meals, fluids, stress, and exercise
Meals, dehydration, acute stress, and vigorous exercise can change several routine results within hours. These short-lived effects are common, but they should not be used to dismiss a markedly abnormal result or symptoms that need medical attention.
Triglycerides rise after eating and commonly peak about 3–6 hours after a fatty meal; non-fasting triglycerides of 175 mg/dL or higher merit follow-up in the right clinical setting. The 2018 AHA/ACC cholesterol guideline accepts non-fasting lipids for many patients, but recommends a fasting repeat when triglycerides are 400 mg/dL or more (Grundy et al., 2019).
Dehydration concentrates albumin, haemoglobin, sodium, urea, and total protein without creating extra cells or protein. A haematocrit of 51% after a hot day or prolonged diarrhoea may fall substantially after normal fluid intake, which is why I review urine specific gravity and weight change before calling it persistent erythrocytosis.
Hard resistance training can raise CK, AST, LDH, creatinine, and potassium for 24–72 hours; marathon effort may push CK into the thousands even without muscle injury. Our exercise and creatinine recheck guide explains when a 48–72-hour rest period produces a cleaner repeat.
Illness and recovery: which results need weeks, not days
Acute infection and tissue response can distort iron markers, white-cell counts, liver enzymes, and thyroid tests for days to weeks after you feel better. A repeat during recovery is meaningful only when the clinical question permits waiting and the patient is clearly improving.
CRP begins rising about 6–8 hours after an inflammatory stimulus and has a half-life near 19 hours, so it can fall quickly once the stimulus resolves. ESR behaves differently: because it is influenced by fibrinogen and red-cell properties, it may remain elevated for several weeks after CRP has normalised.
Serum iron and transferrin saturation often fall during infection because hepcidin sequesters iron, while ferritin rises as an acute-phase reactant. A ferritin below 15 ng/mL strongly supports iron deficiency in otherwise healthy adults, but ferritin of 30–100 ng/mL with raised CRP can conceal depleted stores; ferritin and CRP together are more useful than either alone.
Non-thyroidal illness can lower free T3 and sometimes TSH without primary thyroid disease, particularly after hospitalisation. Dr. Thomas Klein advises avoiding routine thyroid dose changes from a single inpatient panel unless there is a compelling clinical reason; our explanation of low T3 during illness covers the pattern.
Sleep, training load, and hydration can mimic disease
Poor sleep, a new training block, and low fluid intake can alter glucose, cortisol, white cells, CK, creatinine, and haemoconcentration without proving chronic disease. The useful repeat test is collected after a normal night, ordinary hydration, and at least 48 hours without unusually strenuous activity when clinically safe.
A single night of severe sleep restriction can reduce insulin sensitivity the next morning, so a fasting glucose of 108 mg/dL after four hours of sleep needs context rather than panic. Cortisol has a strong diurnal rhythm and is normally highest around 6–8 am, making an afternoon value unsuitable for many adrenal questions.
Exercise-induced leucocytosis is driven partly by adrenaline-mediated demargination, so white cells can rise within minutes of intense effort and decline over hours. A WBC above 20 × 10^9/L, fever, or concerning symptoms should not be attributed to the gym without medical assessment.
Record the last hard session, distance, heat exposure, sleep duration, and fluids next to each result. That small habit makes lab context tracking far more clinically useful than another isolated screenshot.
Diet, fasting, alcohol, and supplements: different biological clocks
A meal changes glucose and triglycerides within hours, while sustained dietary patterns change LDL cholesterol and HbA1c over weeks to months. Fasting longer than the requested interval can itself alter bilirubin, free fatty acids, ketones, and sometimes uric acid.
For a standard fasting lipid or glucose draw, 8–12 hours without caloric intake is usually adequate; water is encouraged unless a clinician says otherwise. Very prolonged fasting may increase unconjugated bilirubin in people with Gilbert syndrome, so a “better” fasting result is not always a more representative result.
Alcohol can raise triglycerides overnight and may raise GGT over repeated weeks of higher intake. Triglycerides of 500 mg/dL or above increase pancreatitis risk and should prompt timely clinical advice, not a self-directed fast-and-retest experiment; see triglycerides after eating.
LDL-C responds more slowly than a single dinner: guideline-directed lipid follow-up is commonly 4–12 weeks after a statin start or dose adjustment (Grundy et al., 2019). A Mediterranean diet marker plan is most informative when the diet has been consistent for at least 6–8 weeks.
Drugs and supplements: when a changed result is expected
Many drugs cause predictable laboratory changes, while a few supplements create assay interference that looks like disease. Do not stop a prescribed medicine to obtain a “clean” result unless the prescribing clinician specifically instructs you to do so.
Biotin doses of 5–10 mg daily, often sold for hair or nails, can interfere with streptavidin-biotin immunoassays and produce falsely low TSH with falsely high free T4 or troponin on susceptible systems. The exact washout depends on dose and assay, but 48–72 hours is a common laboratory instruction for non-urgent testing; our biotin and thyroid assay guide explains why the pattern matters.
ACE inhibitors, ARBs, spironolactone, trimethoprim, and NSAIDs can increase potassium; metformin can lower vitamin B12 over time; and corticosteroids can raise glucose and neutrophils. Potassium above 6.0 mmol/L, especially with weakness, palpitations, or kidney disease, requires urgent clinical assessment rather than a routine repeat.
Kantesti is an AI blood test interpretation platform that prompts users to record medicines, supplements, and collection timing beside a result because a drug effect may be expected yet still need monitoring. Technical performance and clinical oversight are described in our medical validation approach.
Hormones need a calendar, a clock, and sometimes a gestational age
TSH, cortisol, testosterone, estradiol, progesterone, and prolactin are highly sensitive to timing, physiology, and sometimes posture. Comparing hormone results without the cycle day, collection time, pregnancy status, or medication schedule often creates a false trend.
TSH has a circadian rhythm and is generally higher overnight than later in the day, so serial thyroid tests are best collected at roughly the same time. After a levothyroxine dose or brand change, most clinicians wait 6–8 weeks before judging steady-state TSH because the hormone and pituitary response need time to equilibrate.
Progesterone is only interpretable against ovulation timing: a result of 2 ng/mL can be entirely normal before ovulation and unexpectedly low about 7 days after confirmed ovulation. For people using hormonal contraception, many endogenous sex-hormone results cannot answer the same diagnostic questions as an untreated cycle; see testing after birth control.
Pregnancy lowers creatinine through increased filtration, and an eGFR calculated by standard adult equations is not validated for pregnancy. A creatinine of 0.9 mg/dL may deserve more attention in pregnancy than outside it, as explained in our pregnancy kidney guide.
When the sample—not your body—explains the result
Haemolysis, tourniquet time, posture, sample handling, and changing laboratories can create a result difference that is not a biological change. A surprising potassium, LDH, AST, phosphate, or magnesium result should always trigger a check of the specimen comment before a diagnosis is made.
In-vitro haemolysis releases intracellular potassium and LDH into the sample, creating falsely high values; the laboratory may report a haemolysis index or request recollection. A potassium of 5.8 mmol/L with a haemolysed sample and normal kidney function is commonly repeated promptly, while a confirmed 5.8 mmol/L needs clinical context and sometimes an ECG.
Standing for 20–30 minutes can concentrate proteins and cells compared with a rested supine sample, while prolonged tourniquet use can shift potassium and lactate. The EFLM venous-sampling recommendation emphasises patient identification, posture, tourniquet time, and prompt handling because pre-analytical error is a major source of laboratory variation (Simundic et al., 2018).
When a result changes abruptly, compare units and laboratory methods before plotting it. Our hemolysis redraw guide and delta-check explanation can help frame the conversation with the laboratory or clinician.
Fast-moving markers: repeat in hours, days, or a week
Glucose, electrolytes, creatinine, white-cell counts, CRP, and liver enzymes can change quickly enough that a repeat within hours to 7 days may change care. The correct interval depends on severity, symptoms, and whether a reversible trigger is already obvious.
Sodium below 125 mmol/L, potassium above 6.0 mmol/L, glucose below 54 mg/dL, or glucose above 300 mg/dL with illness symptoms are not “watch the graph” findings; they need prompt medical guidance. Trends are valuable only after immediate hazards have been excluded.
ALT and AST have biological half-lives of roughly 47 hours and 17 hours respectively, so a resolving transient liver insult can show a clear downward slope within days. By contrast, GGT often falls more slowly, which can make it appear discordant during recovery; our borderline ALT follow-up describes sensible repeat timing.
A neutrophil count can recover in days after a viral illness, while medication-related suppression may persist. An absolute neutrophil count below 0.5 × 10^9/L is severe neutropenia and warrants urgent clinician contact, especially with fever of 38.0°C or higher.
Slow-moving markers: when waiting prevents false conclusions
HbA1c, ferritin, vitamin D, red-cell indices, LDL cholesterol, and kidney disease staging usually need weeks to months before a repeat shows a stable biological change. Testing them too soon can be emotionally expensive and clinically misleading.
HbA1c reflects weighted average glucose over about 8–12 weeks, with the most recent 30 days contributing more than earlier weeks. A fall from 7.8% to 7.1% after three months is usually interpretable; a repeat at two weeks mainly measures the same red-cell population.
Ferritin can begin rising within weeks of effective iron therapy, but restoring stores often takes 3–6 months after haemoglobin normalises. An early rise in RDW may actually be reassuring because newly produced cells differ in size from older iron-deficient cells; read our RDW after iron treatment.
Chronic kidney disease requires an eGFR below 60 mL/min/1.73 m² or another marker of kidney damage for at least 3 months in most cases. KDIGO’s 2024 guideline therefore treats a single lower eGFR as a signal to repeat and assess urine albumin, not as an automatic diagnosis (KDIGO, 2024).
How to plan a repeat test that can answer the question
A useful repeat test recreates the conditions that matter and deliberately avoids reversible disruptors. For a routine metabolic, lipid, iron, or thyroid comparison, use the same laboratory when possible and document exactly what was different.
For most planned morning panels, keep the collection time within about 1–2 hours of the previous draw, drink water normally, avoid alcohol for 24–48 hours, and avoid unfamiliar intense exercise for 48 hours. Do not alter prescribed doses simply to improve a number; the goal is an honest clinical baseline.
Iron studies are particularly sensitive to context: test in the morning when practical, note iron tablets, and avoid interpreting serum iron during acute illness. If ferritin is borderline and inflammation is present, clinicians may add transferrin saturation, soluble transferrin receptor, or reticulocyte haemoglobin rather than waiting blindly; our iron-study reference guide maps those choices.
Dr. Thomas Klein’s practical rule is simple: write down the last meal, exercise, alcohol, new supplement, illness day, and medication dose time before leaving the laboratory. Those six details can explain more than a second panel costing hundreds of pounds.
How to read a lab trend graph without overreacting
A lab trend graph should show dates, units, reference intervals, collection context, and the rate of change—not just a rising or falling line. Three similarly prepared results moving in one direction usually carry more weight than one dramatic outlier.
Look for slope and clustering. LDL-C moving from 118 to 132 to 148 mg/dL across 18 months is more informative than 118 followed by one 148 mg/dL result after a holiday, particularly if triglycerides and weight rose at the same visit.
Reference ranges are population intervals, commonly the central 95%, not personal targets or diagnosis lines. A value may remain “normal” while moving substantially from your own baseline, and a value just outside range may be harmless if it is stable and explained by a known factor.
Kantesti is an AI-powered blood test analysis tool that organises longitudinal results into contextual comparisons, including unit conversion and related-marker patterns. Readers who want the mechanics can review our lab trend graph guide.
When not to wait for a repeat blood test
Symptoms, a critical value, or a worsening multi-marker pattern outweigh the convenience of waiting for a cleaner repeat. Chest pain, shortness of breath, confusion, fainting, new jaundice, black stools, severe weakness, or reduced urine output need urgent assessment regardless of a planned blood test timeline.
A troponin rise is interpreted against symptoms, ECG findings, and serial timing, not a home-made trend chart. Likewise, bilirubin above 3 mg/dL with yellow skin or dark urine, or ALT more than 5 times the laboratory upper limit, deserves timely medical review rather than a lifestyle-only experiment.
The pattern matters. Anaemia plus a falling platelet count, rising creatinine plus protein in urine, or high calcium plus weight loss is more concerning than one mildly unusual value because the combination narrows the clinical differential.
Kantesti AI can help organise questions before an appointment, but it does not replace urgent evaluation, examination, or clinician-led diagnosis. Our medical advisory board reviews safety principles that guide escalation recommendations.
Your personal baseline matters more than a single reference range
A personal baseline is built from repeated, comparable results collected when you are well, not from one annual panel. It is especially valuable for markers with wide reference intervals, including creatinine, bilirubin, neutrophils, ferritin, and thyroid hormones.
Creatinine of 1.0 mg/dL may be ordinary for one muscular adult and a meaningful rise from a longstanding 0.65 mg/dL for another. eGFR adds age and sex to the calculation, yet urine albumin-to-creatinine ratio and repeated measurements often decide whether kidney risk is present.
Family history changes the question, not necessarily the interval. A parent with premature coronary disease makes persistent LDL-C of 160 mg/dL or lipoprotein(a) testing more relevant, while a relative with haemochromatosis may justify targeted iron studies rather than repeated broad panels.
Our personal baseline guide explains how to preserve original reports, laboratory ranges, and context. If several relatives share records, keep consent and access boundaries explicit; family lab history tracking should never mean informal sharing of private health data.
A safer workflow for longitudinal blood test analysis
Longitudinal blood test analysis works best when it separates urgent abnormalities, likely temporary influences, and slower risk trends before offering questions for a clinician. As of August 14, 2026, that sequence remains more useful than declaring a result “good” or “bad” from a reference-range colour alone.
Kantesti AI interprets uploaded PDF or photo reports by extracting reported values, units, dates, and reference ranges, then aligning related biomarkers across visits. Our service supports more than 2 million users in 127+ countries and 75+ languages, but the original laboratory report remains the source document to retain and share with your clinician.
A good review workflow asks four questions in order: could this be urgent, could collection or assay conditions explain it, does a related-marker pattern support it, and has it persisted long enough to matter? This is the logic behind our AI comparison workflow and our technology guide.
Kantesti LTD uses privacy-focused, GDPR-aligned handling, yet no automated interpretation can see your examination findings, imaging, symptoms, or full prescription history. For source-checking before you act, read our AI report safety checklist; the best result is a focused, well-timed conversation with your treating team.
Frequently Asked Questions
How long should I wait to repeat a blood test after being sick?
For a mild, resolved viral illness, many routine tests can be repeated 1–2 weeks after you feel well, but iron studies, ESR, ferritin, and thyroid results may need 4–6 weeks for cleaner interpretation. CRP can fall within days because its half-life is about 19 hours, whereas ESR often declines more slowly. Do not delay a repeat when the result is critical, symptoms persist, or your clinician is monitoring kidney function, electrolytes, severe anaemia, or liver injury. The safest interval depends on the marker and the reason the test was ordered.
Can one day of exercise affect blood test results?
Yes, unfamiliar vigorous exercise can raise creatine kinase, AST, LDH, creatinine, potassium, and white-cell count for 24–72 hours, and CK may remain elevated for 3–7 days after endurance events. A CK above 5,000 IU/L, dark urine, severe muscle pain, or reduced urination requires urgent medical assessment rather than routine retesting. For a planned comparison, avoid unusually hard training for 48 hours if your clinician agrees. Normal daily walking does not usually require special preparation.
How soon do cholesterol results change after diet changes?
Triglycerides can change within days and after a single meal, but LDL cholesterol usually needs 4–12 weeks of a sustained dietary, weight, or medication change before a follow-up test is clinically useful. The AHA/ACC cholesterol guideline commonly uses a 4–12-week lipid recheck after starting or changing statin therapy. A 1-week LDL change may reflect fasting status, laboratory variation, alcohol intake, or short-term weight fluctuation. Compare tests collected under similar conditions whenever possible.
Can dehydration cause abnormal blood tests?
Dehydration can temporarily increase haemoglobin, haematocrit, albumin, total protein, sodium, urea, and sometimes creatinine because plasma water is reduced. A high haematocrit after heat exposure, vomiting, or diarrhoea may normalise after ordinary hydration, but it should not be assumed benign when it remains above 52% in men or 48% in women. Severe dehydration can also cause true kidney injury and electrolyte disturbance. Symptoms such as confusion, fainting, very low urine output, or inability to keep fluids down need urgent care.
Should I stop vitamins before a blood test?
Do not stop prescribed medicines without the prescriber’s advice, but tell the laboratory and clinician about every vitamin and supplement. Biotin at 5–10 mg daily can interfere with some thyroid and troponin immunoassays; many laboratories advise withholding it for 48–72 hours before non-urgent testing, though the exact interval depends on dose and assay. Iron, B12, vitamin D, and folate supplements can also change the result being measured. The goal is transparent interpretation, not trying to manufacture a preferred number.
What blood tests need to be repeated after 3 months?
HbA1c is commonly repeated after about 3 months because it reflects weighted average glucose over the previous 8–12 weeks. Chronic kidney disease requires an eGFR below 60 mL/min/1.73 m² or another marker of kidney damage to persist for at least 3 months in most cases. LDL cholesterol, ferritin, vitamin D, and red-cell indices may also need 8–12 weeks or longer depending on treatment and the clinical question. Urgent abnormalities such as potassium above 6.0 mmol/L should be repeated or assessed much sooner.
Get AI-Powered Blood Test Analysis Today
Join over 2 million users worldwide who trust Kantesti for instant, accurate lab test analysis. Upload your blood test results and receive comprehensive interpretation of 15,000+ biomarkers in seconds.
📚 Referenced Research Publications
Klein, T., Mitchell, S., & Weber, H. (2026). B Negative Blood Type, LDH Blood Test & Reticulocyte Count Guide. Kantesti AI Medical Research.
Klein, T., Mitchell, S., & Weber, H. (2026). Diarrhea After Fasting, Black Specks in Stool & GI Guide 2026. Kantesti AI Medical Research.
📖 External Medical References
⚕️ Medical Disclaimer
This article is for educational purposes only and does not constitute medical advice. Always consult a qualified healthcare provider for diagnosis and treatment decisions.
E-E-A-T Trust Signals
Experience
Physician-led clinical review of lab interpretation workflows.
Expertise
Laboratory medicine focus on how biomarkers behave in clinical context.
Authoritativeness
Written by Dr. Thomas Klein with review by Dr. Sarah Mitchell and Prof. Dr. Hans Weber.
Trustworthiness
Evidence-based interpretation with clear follow-up pathways to reduce alarm.