
Low prealbumin does not prove malnutrition: inflammation, liver function, kidney function, and fluid balance can change the result independently of food intake. A useful interpretation connects the number with weight changes, muscle loss, actual intake, and the illness behind the test.

נקודות עיקריות
- Low prealbumin means a circulating protein concentration is below your laboratory's interval; a result of 12 mg/dL does not establish malnutrition.
- Prealbumin normal range is commonly approximately 20–40 mg/dL in adults, equivalent to 0.20–0.40 g/L, but laboratories use different intervals.
- דלקת can reduce prealbumin production despite adequate eating; its approximately 2–3-day half-life makes illness-related changes appear quickly.
- CRP context helps explain low prealbumin, but there is no validated CRP correction formula that converts the result into nutritional status.
- Malnutrition diagnosis under GLIM requires at least 1 phenotypic criterion and 1 etiologic criterion after nutritional risk screening—not a low protein result alone.
- Weight loss greater than 5% within 6 months is a GLIM phenotypic criterion, even when BMI remains above the usual healthy-weight interval.
- Nutrition support should address documented needs and eating barriers; general NICE estimates of 25–35 kcal/kg/day are not suitable starting targets for everyone.
- Refeeding risk needs clinical assessment after prolonged minimal intake; more than 10 days with little or no nutrition is one NICE high-risk criterion.
Does low prealbumin mean you are malnourished?
Low prealbumin can accompany malnutrition, but it cannot diagnose it. A concentration of 12 mg/dL may reflect inflammation, impaired liver production, inadequate intake, or several factors together; nutritional status requires assessment of weight, muscle, intake, and the underlying illness.

A laboratory flag describes the concentration of one protein, not the amount of protein stored in your muscles. The 2021 ASPEN position paper states that albumin and prealbumin primarily characterize inflammation rather than nutritional status and should not be used as proxies for body protein or muscle mass (Evans et al., 2021). Low values can still identify people who need closer clinical attention.
Consider a hypothetical adult who eats their usual meals but develops pneumonia and has prealbumin of 11 mg/dL. Another adult with the same result may have eaten very little for 3 weeks because swallowing is difficult; the identical number does not tell clinicians which explanation applies. Both deserve assessment, but the treatment priorities are different.
Kantesti is an AI blood test analyzer that helps explain why a prealbumin result of 12 mg/dL needs clinical context rather than an automatic malnutrition label. Our ארגון ומטרה include making laboratory information understandable—not replacing a clinician's examination or a dietitian's assessment. The useful question is what explains the result and what evidence independently establishes a nutrition problem.
What is the prealbumin normal range?
A commonly used adult prealbumin normal range is approximately 20–40 mg/dL, equivalent to 0.20–0.40 g/L. Your report's own interval takes priority because age, assay method, and the laboratory's reference population affect the limits.
Different reference intervals do not necessarily mean that one laboratory is wrong. Some reports use intervals around 15–36 mg/dL, so a hypothetical value of 18 mg/dL could be flagged by one laboratory and unflagged by another; neither classification independently establishes nutritional adequacy. Reference intervals describe a comparison population, whereas diagnostic criteria must identify a clinically meaningful condition.
Unit conversion can prevent a much larger misunderstanding than a borderline flag. Prealbumin of 200 mg/L equals 20 mg/dL and 0.20 g/L; a report showing 0.18 g/L therefore means 18 mg/dL, not an extraordinarily tiny concentration. Before comparing two reports, match the units, laboratory interval, and sampling circumstances rather than comparing the printed numbers alone.
A concentration below 10 mg/dL is substantially below many adult reference intervals, but there is no universal prealbumin-only emergency threshold or validated severity scale for malnutrition. The מדריך לאלבומין וחלבונים בסרום explains why circulating proteins are not interchangeable with nutritional assessment. Pediatric results require age-specific interpretation; the adult table below should not be applied to children.
| רמה | טווח | מה פירוש הדבר |
|---|---|---|
| טווח נפוץ למבוגרים | 20–40 מ״ג/ד״ל | Within one commonly used interval; does not exclude malnutrition. |
| Below this example interval | 10–<20 mg/dL | Review inflammation, intake, liver function, kidney function, and fluid balance. |
| Markedly below this interval | <10 מ"ג/ד"ל | Needs clinical explanation; not a stand-alone malnutrition grade or emergency cutoff. |
| Above this example interval | >40 mg/dL | May occur with reduced renal catabolism or medication effects; does not prove excellent nutrition. |
What does the prealbumin test actually measure?
The prealbumin test measures טרנסתירטין, a transport protein produced mainly by the liver for circulation. Its approximately 2–3-day half-life allows relatively rapid changes, but a rapid response does not make it specific to food intake.
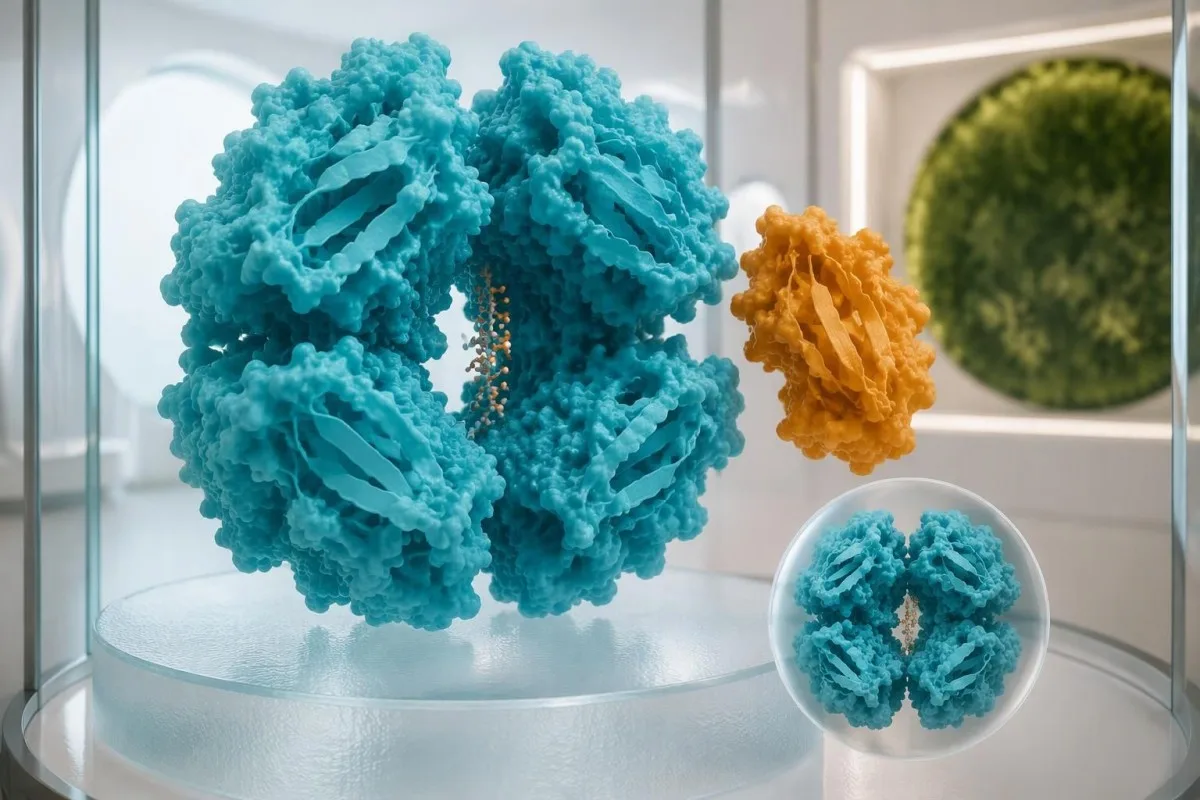
Prealbumin is not an immature form of albumin and does not turn into albumin. The name comes from its migration ahead of albumin during electrophoresis; albumin has a much longer circulating half-life, roughly 20 days, compared with about 2–3 days for prealbumin. These different turnover rates explain why the two results can move at different speeds during an illness.
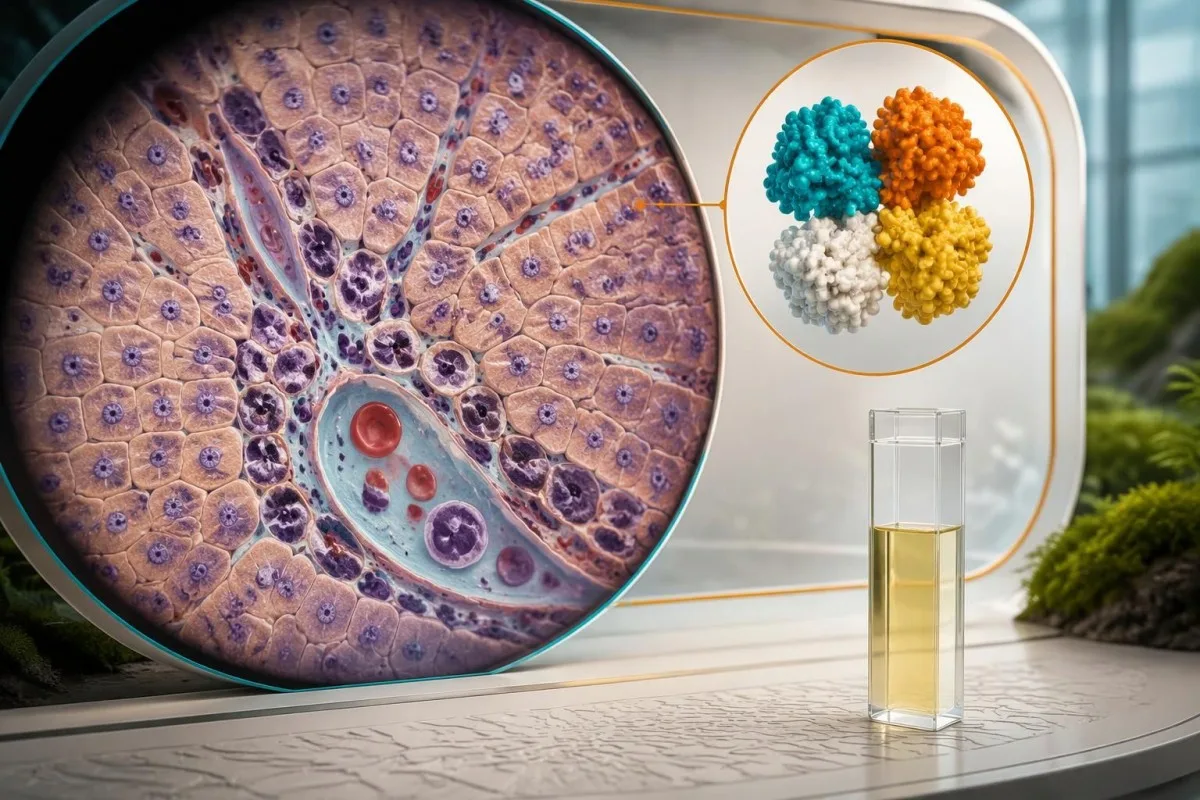
Transthyretin normally forms a tetramer of 4 protein subunits and carries some circulating thyroxine, or T4. It also interacts with retinol-binding protein, which carries vitamin A; a low prealbumin concentration nevertheless does not independently diagnose either thyroid disease or vitamin A deficiency. Transport-protein concentration, hormone activity, and tissue nutrient stores answer different biological questions.
A low concentration is also different from finding a disease-associated variant in the TTR gene. A hypothetical prealbumin result of 14 mg/dL is not a genetic screening result and does not diagnose hereditary ATTR amyloidosis; that evaluation uses a separate clinical and genetic pathway. Our explanation of TTR variants and amyloidosis helps separate these easily confused meanings of the same protein name.
Why does inflammation lower prealbumin despite eating?
Prealbumin is a negative acute-phase protein: its circulating concentration often falls during inflammation as liver protein production changes. A hypothetical value of 10 mg/dL during severe illness can therefore occur even when recent calorie and protein intake have been adequate.
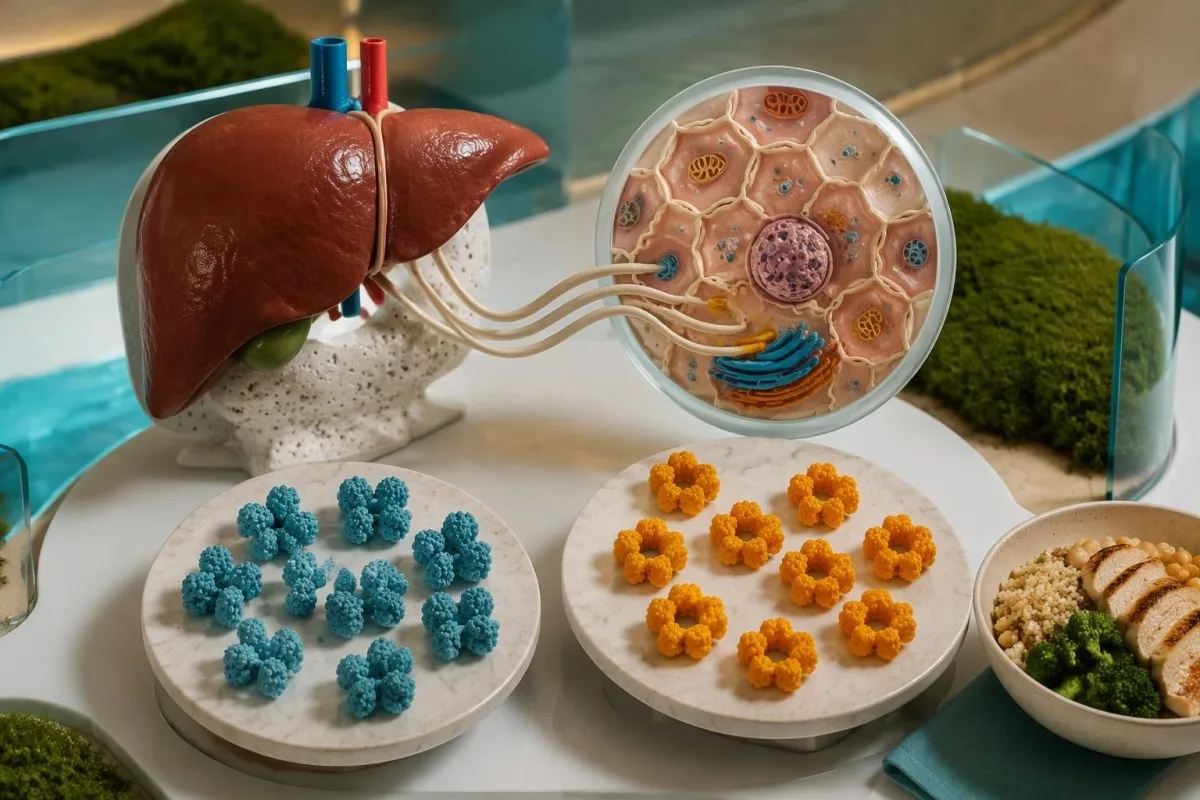
Inflammatory signaling changes what the liver produces rather than simply indicating that the patient skipped meals. Mediators including interleukin-6 promote the acute-phase response, while concentrations of proteins such as prealbumin can decline; its 2–3-day half-life makes that shift relatively quick. The IL-6 interpretation guide explains why timing and illness context matter, although IL-6 testing is not routinely needed to assess nutrition.
Inflammation can lower prealbumin independently of intake and also increase nutritional risk through appetite loss and catabolism. These are 2 overlapping processes, not competing explanations: a person may initially eat adequately yet lose muscle during prolonged illness because the body's metabolic demands and tissue breakdown have changed. Calling the result 'just inflammation' can therefore be as misleading as calling it proof of starvation.
Other negative acute-phase proteins may move in the same direction, so a combination of low prealbumin and low transferrin does not provide 2 independent confirmations of malnutrition. Their shared response to inflammation can create an apparently convincing pattern from the same underlying mechanism. Our guide to inflammation and low transferrin explains why clinicians examine the cause before interpreting several low transport proteins as dietary deficiencies.
How should prealbumin and CRP be read together?
CRP helps identify inflammatory context, but it cannot correct prealbumin into a nutrition score. A hypothetical combination of prealbumin 12 mg/dL and CRP 90 mg/L strongly raises concern that an acute-phase response is influencing the protein result.
A normal CRP reduces evidence for a substantial systemic acute-phase response at that moment, but it does not prove that low prealbumin is dietary. Many laboratories use a CRP upper limit around 5 mg/L, while others use 10 mg/L; sampling timing, localized disease, and liver disease can complicate interpretation. There is no universal CRP cutoff below which prealbumin becomes a validated malnutrition test.
Discordant inflammatory markers should lead to questions about timing, symptoms, and treatment rather than a mathematical workaround. A hypothetical patient with prealbumin 13 mg/dL, CRP 4 mg/L, and a normal white cell count still needs an intake and weight history; clinicians may also investigate liver function or persistent symptoms. Our discussion of disagreeing infection markers explains why one reassuring marker cannot settle the whole clinical picture.
Kantesti AI can help readers distinguish a prealbumin result of 12 mg/dL from a CRP result of 90 mg/L and understand what each measurement contributes. Neither a prealbumin-to-CRP ratio nor dividing one value by the other is an accepted substitute for nutritional assessment. When CRP is missing, that uncertainty should remain visible—not be replaced by a confident dietary diagnosis.
How do liver and kidney disease change prealbumin?
Liver disease can reduce prealbumin production, while impaired kidney function can increase its concentration through reduced catabolism. A value of 15 mg/dL or 45 mg/dL therefore cannot be interpreted as poor or excellent nutrition without knowing the organ-function context.
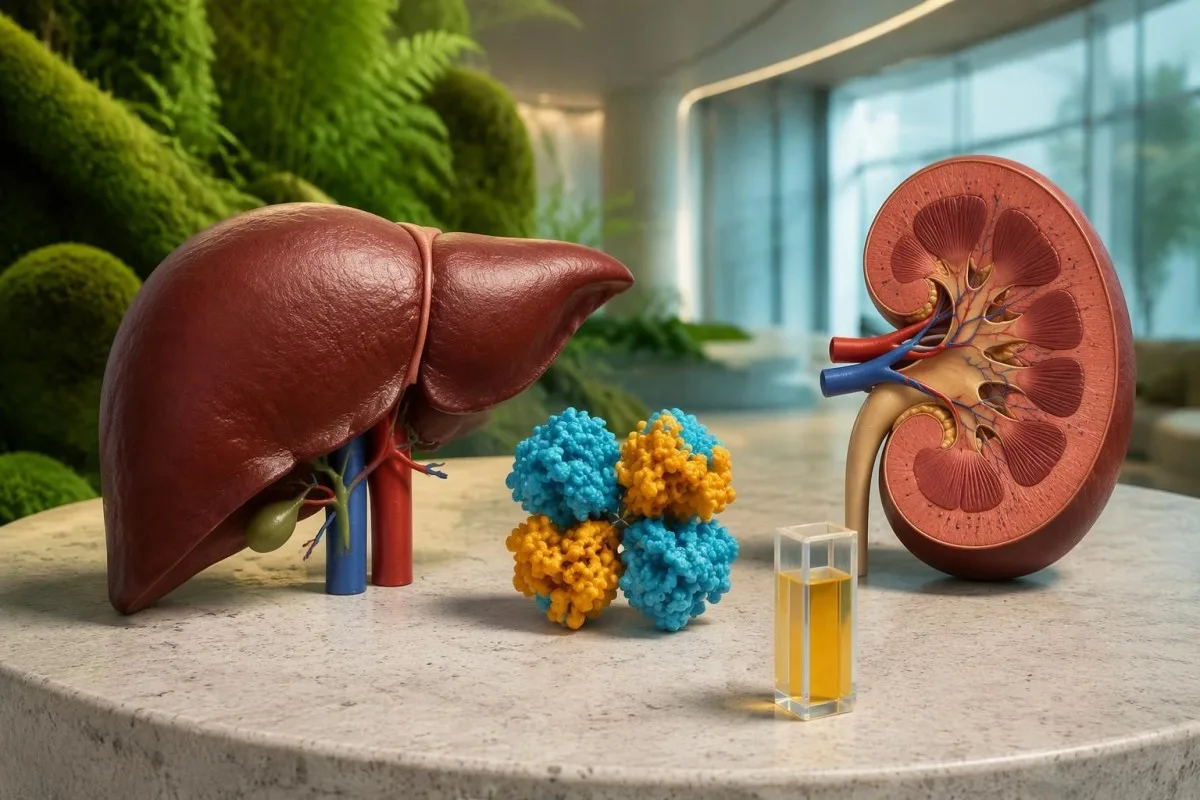
Reduced hepatic synthetic capacity is different from an isolated rise in a liver enzyme. A hypothetical ALT of 80 IU/L does not quantify how much prealbumin the liver can produce; clinicians consider the broader pattern, including albumin, bilirubin, coagulation results, history, and examination. The רמזים מעבדתיים לשחמת guide explains why apparently modest enzyme changes can coexist with more significant liver dysfunction.
Kidney disease can pull the result in more than one direction because reduced catabolism may raise prealbumin while concurrent inflammation or poor intake lowers it. A hypothetical adult with eGFR 25 mL/min/1.73 m² and prealbumin 38 mg/dL may still have clinically significant weight and muscle loss. Our guide to סימני אזהרה של eGFR נמוך explains the kidney findings that deserve attention beyond this transport protein.
Protein loss in urine should be assessed directly rather than inferred from prealbumin. Urine albumin or protein measurements, serum albumin, and kidney evaluation answer questions that a prealbumin concentration of 16 mg/dL cannot resolve; nephrotic conditions do not produce a reliably predictable prealbumin pattern. The practical step is to bring renal results and liver results to the same appointment, especially before changing protein intake substantially.
Can fluids, medicines, or assay problems alter results?
Fluid balance, some medicines, and method-specific assay interference can change prealbumin test results. A hypothetical decline from 22 to 16 mg/dL after major fluid administration may partly reflect dilution rather than a sudden change in nutritional reserves.
Prealbumin is a concentration measurement, so the amount of circulating fluid affects how the result is expressed. Rapid fluid retention can lower measured concentrations, while dehydration can raise them; a 3 kg weight increase over several days may represent fluid rather than new tissue. Clinicians therefore distinguish weight recovery from edema and avoid interpreting a falling protein concentration in isolation after resuscitation.
Corticosteroids can increase prealbumin concentrations, although the overall result also depends on the illness being treated. A hypothetical change from 18 to 25 mg/dL after corticosteroid treatment could reflect medication effects, reduced inflammation, nutritional changes, or a mixture of all 3. Record the medicine's name, dose, and start date rather than assuming every increase means that a nutrition plan succeeded.
An unexpected isolated result deserves a check of units, specimen quality, and the laboratory's interference notes before extensive dietary changes. A hypothetical prealbumin of 9 mg/dL alongside several unexpected assay findings may justify discussion with the laboratory; interference is method-dependent, not something every patient needs repeat testing for. Our explanation of inflammation and plasma zinc also shows why several low circulating nutrients or proteins may share a non-dietary explanation.
What criteria actually diagnose adult malnutrition?
GLIM diagnoses adult malnutrition using at least 1 phenotypic criterion and 1 etiologic criterion after nutritional risk screening. Phenotypic criteria include weight loss, low BMI, or reduced muscle mass; etiologic criteria include reduced intake or assimilation, or inflammation and disease burden.

The international GLIM consensus uses unintentional weight loss greater than 5% within 6 months, or greater than 10% beyond 6 months, as a phenotypic criterion (Cederholm et al., 2019). A hypothetical change from 70 to 66 kg is approximately 5.7% loss, even if the person still appears well nourished. The timing and whether the loss was intended matter as much as the arithmetic.
GLIM's commonly used non-Asian low-BMI thresholds are below 20 kg/m² for adults younger than 70 and below 22 kg/m² for adults aged 70 or older, with population-specific adaptations. These are diagnostic-framework thresholds, not universal healthy-weight boundaries; reduced muscle mass can establish a phenotype even when BMI is higher. Neither BMI nor prealbumin alone captures how much functional tissue a person has lost.
Kantesti is an AI biomarker interpretation platform that explains why prealbumin of 14 mg/dL cannot replace GLIM's clinical criteria. Specific deficiencies can coexist with malnutrition, but a low folate result is a different diagnostic question from total calorie and protein adequacy; our guide to folate deficiency causes makes that distinction. A nutrition assessment should identify the syndrome and its cause, not collect abnormal laboratory flags as a substitute.
What should a proper nutrition assessment include?
A useful nutrition assessment documents weight trajectory, actual intake, eating barriers, muscle changes, and disease burden. Reviewing the previous 1–6 months often reveals more than a single prealbumin concentration, particularly when fluid retention or a higher BMI hides tissue loss.

A higher BMI does not exclude malnutrition after substantial unintentional weight loss. A hypothetical adult weighing 80 kg who falls to 74 kg has lost 7.5%; at 1.65 m tall, the current BMI remains approximately 27.2 kg/m² despite that meaningful change. Clinicians ask whether clothing fits differently, strength has declined, and swelling is masking further tissue loss rather than judging nutritional status from appearance.
Reduced intake should be investigated as a symptom with a cause, not treated as a failure of motivation. Difficulty swallowing, painful eating, nausea, dental problems, limited food access, and medication effects require different solutions; a 3-day food record can help describe the pattern but does not diagnose malabsorption. Persistent swallowing problems may need evaluation such as the pathway described in our achalasia diagnostic guide.
Digestive investigations should follow symptoms and risk factors instead of being ordered because prealbumin is below 20 mg/dL. Chronic diarrhea with weight loss may warrant targeted evaluation for intestinal disease, whereas visible food fragments alone do not establish nutrient malabsorption. Our guide to stool inflammation tests explains what those tests can contribute; muscle assessment and intake history still remain necessary even when gastrointestinal testing identifies a cause.
When is repeating prealbumin actually useful?
Repeating prealbumin is useful only when the result will answer a defined clinical question. Its 2–3-day half-life does not justify routine testing every few days, and an increase cannot independently prove that nutrition treatment has restored muscle or body protein.

Prealbumin can rise as inflammation resolves even when food intake has changed very little. In a hypothetical recovery, prealbumin increases from 10 to 18 mg/dL while CRP falls from 120 to 8 mg/L over 10 days; the pattern supports a changing acute-phase response but cannot quantify how much nutrition contributed. Improved concentration is not equivalent to restored strength, healed tissue, or replenished lean mass.
If a clinician chooses to repeat testing, an interval such as 1–2 weeks after a meaningful clinical change may be reasonable, but it is not a universal guideline schedule. Record the illness course, fluid status, medication changes, intake, and laboratory method at both time points. Our guide to meaningful laboratory trends explains why the circumstances surrounding each measurement determine whether comparison is informative.
Kantesti can help organize dated prealbumin measurements, but 2 results cannot reveal unrecorded food intake or establish muscle recovery. ASPEN's 2021 position paper advises against using visceral proteins as nutrition markers, so clinical outcomes and documented intake should lead monitoring rather than a target prealbumin value (Evans et al., 2021). Ask what management decision would change before arranging another measurement.
Should you increase protein to raise prealbumin?
Increase nutrition when an assessment identifies inadequate intake or increased needs—not simply to push prealbumin above 20 mg/dL. A low result does not specify a protein dose, and kidney disease, severe illness, fluid restrictions, and refeeding risk can change the appropriate plan.

For adults requiring nutrition support who are not severely ill and are not at refeeding risk, NICE CG32 gives general estimates of 25–35 kcal/kg/day and 0.8–1.5 g protein/kg/day (NICE, 2006). These are planning ranges with clinical exceptions, not instructions for everyone with low prealbumin. The CG32 nutrition-support guidance also addresses fluid, electrolytes, micronutrients, and the route through which nutrition is delivered.
A hypothetical 60 kg adult would have an estimated range of 1,500–2,100 kcal/day and 48–90 g protein/day under those general assumptions. The wide range reflects different needs; it is not a reason to choose the highest protein intake automatically, particularly with kidney disease. Our discussion of מגבלות בטיחות בתזונה לחולי כליות explains why an AI-generated plan still needs appropriate clinical constraints.
Food fortification or oral nutrition supplements may help when ordinary meals do not meet documented needs, but treating the eating barrier remains necessary. A hypothetical person managing only 50% of meals because of persistent nausea needs evaluation of the nausea as well as a feasible nutrition plan. There is no established prealbumin threshold that automatically requires protein powders, intravenous nutrition, or a particular supplement formulation.
When do low intake and illness need urgent attention?
Urgency comes from symptoms, prolonged inadequate intake, and metabolic risk—not the prealbumin number alone. NICE identifies more than 10 days with little or no nutrition as one high-risk criterion for refeeding problems, which require supervised nutrition restoration.
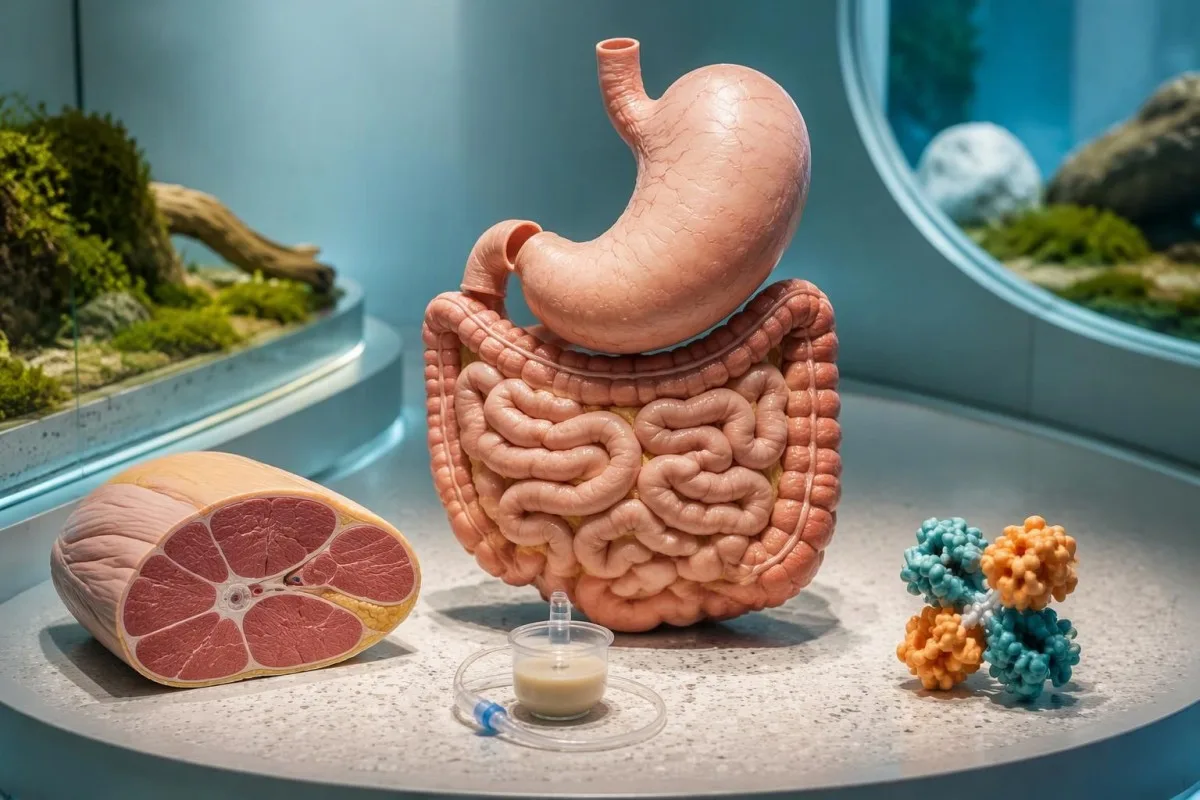
Seek urgent care for confusion, fainting, severe weakness, inability to keep fluids down, very little urine, or breathing difficulty, regardless of whether prealbumin is 8 or 28 mg/dL. Persistent vomiting or diarrhea can create dehydration and electrolyte problems before a transport-protein result becomes informative. Our digestive warning signs guide helps distinguish symptoms that need assessment rather than another nutrition-marker test.
Refeeding risk depends on history and clinical findings, not on a low prealbumin concentration. NICE lists BMI below 16 kg/m², unintentional weight loss greater than 15% over 3–6 months, more than 10 days of minimal intake, or low potassium, phosphate, or magnesium before feeding as individual high-risk criteria; combinations of less severe findings can also qualify. A normal initial electrolyte result does not guarantee that body stores are adequate.
For people who have eaten little or nothing for more than 5 days, NICE recommends initially introducing nutrition at no more than 50% of requirements for the first 2 days, with monitoring. High-risk plans may start at no more than 10 kcal/kg/day under experienced clinical supervision, with thiamine and electrolyte management (NICE, 2006). These figures explain why simply drinking several high-calorie supplements at once can be unsafe after prolonged restriction—they are not a home treatment protocol.
How can AI help interpret prealbumin safely?
AI can explain prealbumin terminology, organize related results, and identify missing context; it cannot diagnose nutritional status from a laboratory report alone. A result of 12 mg/dL needs information about illness, intake, weight, medications, and organ function before its meaning becomes clearer.
Kantesti is an AI blood test interpretation platform that helps explain why prealbumin of 12 mg/dL and CRP of 90 mg/L should be read as different measurements. Our הסבר טכנולוגיית AI describes the interpretation workflow; the safe clinical boundary remains the same whether the explanation is generated quickly or reviewed slowly. Software cannot palpate muscle, observe swallowing, or independently verify the meals someone actually consumed.
A useful interpretation separates measured facts from missing information instead of presenting one confident diagnosis. For example, a hypothetical report containing prealbumin 12 mg/dL but no CRP or weight history should describe those gaps and suggest discussion of nutritional screening, rather than assign a malnutrition grade. Check whether the explanation preserves your laboratory's units and reference interval before using it to prepare questions for an appointment.
Clinical standards should be judged against the specific task, not a broad accuracy claim that covers every medical decision. Even a correct interpretation of 20 mg/dL cannot establish nutrition adequacy without an assessment, and no software benchmark changes that limitation. Our מסגרת האימות והפיקוח is relevant to evaluating methodology; decisions about nutrition support, diagnosis, or urgent care remain matters for qualified healthcare professionals.
Which publications support these nutrition limits?
The clinical conclusions here rest on nutrition guidance, not on unrelated AI publications. The 2021 ASPEN position paper, the 2019 GLIM consensus, and NICE CG32 address different questions: protein-marker limitations, malnutrition diagnosis, and safe nutrition support.
ASPEN's 2021 paper explains why low visceral proteins should not serve as nutrition markers, while GLIM's 2019 consensus specifies the clinical criteria needed to diagnose malnutrition. Neither establishes a prealbumin-only diagnostic cutoff such as 10 or 15 mg/dL; these numbers can describe laboratory abnormalities without proving their cause. NICE CG32 adds practical safety guidance for nutrition support, including the separate assessment of refeeding risk.
Shared inflammatory effects also explain why a broader laboratory panel needs careful interpretation rather than simple abnormal-result counting. A hypothetical low prealbumin of 13 mg/dL alongside low transferrin may reflect one acute-phase mechanism; ferritin can move in the opposite direction during inflammation and complicate assessment of iron stores. Our מדריך לפרשנות בדיקות ברזל explains why biochemical pattern recognition must remain connected to the clinical question.
Kantesti's 2 Figshare publications listed below concern women's health education and multilingual hantavirus decision support, respectively. They are included as separate research resources, not as evidence that prealbumin diagnoses malnutrition or that an AI nutrition plan improves clinical outcomes. Our תקני תוכן רפואי explain the source-quality distinction readers should expect: a repository DOI identifies a publication, but it does not by itself establish peer review or relevance to this nutrition question.
שאלות נפוצות
האם רמה נמוכה של פרה-אלבומין מעידה תמיד על תת-תזונה?
רמת פרה־אלבומין נמוכה אינה מעידה תמיד על תת־תזונה, ואי אפשר לאבחן תת־תזונה על סמך תוצאה זו בלבד. תוצאה של 12 mg/dL עשויה לשקף דלקת, ירידה בייצור בכבד, צריכה לא מספקת או שילוב של כמה גורמים. הערכת תת־תזונה בקרב מבוגרים מביאה בחשבון ירידה לא מכוונת במשקל, מסת שריר, צריכה תזונתית או הטמעה של רכיבי תזונה ואת עומס המחלה. מסגרת GLIM מחייבת לפחות קריטריון פנוטיפי אחד וקריטריון אטיולוגי אחד לאחר סינון סיכון תזונתי.
מהי רמת פרה־אלבומין תקינה?
טווח הייחוס המקובל לפרה־אלבומין במבוגרים הוא כ־20–40 mg/dL, השווים ל־0.20–0.40 g/L. מעבדות מסוימות משתמשות בטווחים אחרים, ולכן יש להעדיף את הטווח המופיע בדוח שלך. ערך של 200 mg/L שווה ל־20 mg/dL, דבר שחשוב להביא בחשבון בהשוואה בין דוחות המשתמשים ביחידות שונות. תוצאה שנמצאת בטווח אינה שוללת תת־תזונה, ולתוצאות בילדים נדרשת פרשנות המותאמת לגיל.
האם דלקת יכולה להוריד את רמת הפרה־אלבומין כשאני אוכל מספיק?
דלקת עלולה להוריד את רמת הפרה־אלבומין גם כאשר צריכת המזון בתקופה האחרונה מספקת, משום שפרה־אלבומין הוא חלבון שלילי בשלב החריף. זמן מחצית החיים שלו, כ־2–3 ימים, מאפשר לריכוזים להשתנות במהירות יחסית, כאשר ייצור החלבונים בכבד משתנה במהלך מחלה. CRP יכול לסייע בזיהוי ההקשר הזה, אך אין נוסחת תיקון מאומתת של CRP להערכת המצב התזונתי. גם אכילה מספקת אינה מונעת לחלוטין אובדן מסת שריר הקשור למחלה במהלך פירוק ממושך של רקמות.
האם רמת פרה־אלבומין נמוכה מ־10 מ״ג/ד״ל מסוכנת?
Prealbumin below 10 mg/dL is substantially below many adult reference intervals, but it is not a stand-alone emergency threshold or a validated malnutrition severity grade. Clinicians assess the underlying illness, food intake, weight change, organ function, and symptoms to determine urgency. Confusion, fainting, inability to keep fluids down, very little urine, or breathing difficulty require urgent assessment regardless of the prealbumin result. Prolonged minimal intake also needs evaluation for refeeding risk before rapid nutrition increases.
How quickly should prealbumin improve with better nutrition?
There is no reliable prealbumin improvement timetable that proves a nutrition treatment is working. Although its half-life is approximately 2–3 days, prealbumin can rise because inflammation resolves or medication and fluid effects change. A hypothetical increase from 10 to 18 mg/dL therefore cannot independently quantify nutritional recovery. Monitoring should prioritize documented intake, weight interpreted alongside fluid balance, muscle function, and the underlying clinical condition.
Should I take protein supplements for low prealbumin?
A low prealbumin result alone does not establish a need for protein supplements or determine a safe dose. For selected adults requiring nutrition support without severe illness or refeeding risk, NICE gives general planning estimates of 0.8–1.5 g protein/kg/day, but individual requirements and restrictions vary. Kidney disease, swallowing problems, and prolonged minimal intake can change the appropriate plan. Discuss actual intake and nutrition risk with a clinician or dietitian rather than trying to raise the laboratory number.
קבלו הסבר על תוצאות בדיקות הדם שלכם
העלו את דוח המעבדה שלכם, וה-AI של Kantesti יסביר כל סמן ביולוגי בשפה פשוטה בתוך שניות. יותר מ-2 מיליון אנשים ברחבי העולם משתמשים בו.
הפניות
- Klein, T., Mitchell, S., & Weber, H. (2026). מדריך לבריאות האישה: ביוץ, גיל המעבר ותסמינים הורמונליים. מחקר רפואי של Kantesti AI. DOI
- Klein, T., Mitchell, S., & Weber, H. (2026). תמיכה רב־לשונית בקבלת החלטות קליניות בסיוע בינה מלאכותית למיון מוקדם של נגיף ההנטה: תכנון, תיקוף הנדסי והטמעה בעולם האמיתי על פני 50,000 דוחות של פענוח בדיקות דם. מחקר רפואי של Kantesti AI. DOI
- Evans DC et al. (2021). The Use of Visceral Proteins as Nutrition Markers: An ASPEN Position Paper. Nutrition in Clinical Practice. DOI
- Cederholm T et al. (2019). GLIM criteria for the diagnosis of malnutrition – A consensus report from the global clinical nutrition community. Clinical Nutrition. DOI
- National Institute for Health and Care Excellence (2006). Nutrition support for adults: oral nutrition support, enteral tube feeding and parenteral nutrition. NICE Clinical Guideline CG32.
- 2 מיליון+בדיקות שנותחו
- 127+מדינות
- 100+שפות
על הצוות הרפואי


אותות אמון E-E-A-T
הִתנַסוּת
סקירה קלינית בהובלת רופא של תהליכי עבודה לפענוח בדיקות מעבדה.
מוּמחִיוּת
רפואה מעבדתית מתמקדת באופן שבו סמנים ביולוגיים מתנהגים בהקשר קליני.
סמכותיות
נבדק רפואית על ידי ד״ר Thomas Klein, בתרומתם של ד״ר Sarah Mitchell ופרופ׳ ד״ר Hans Weber.
אֲמִינוּת
פרשנות מבוססת-ראיות עם מסלולי המשך ברורים כדי להפחית בהלה.
הצהרה רפואית
מאמר זה מיועד למטרות חינוכיות בלבד ואינו מהווה ייעוץ רפואי. תמיד יש להתייעץ עם גורם מוסמך בתחום הבריאות לצורך החלטות אבחון וטיפול.
פורסם · צרו קשר עם צוות העריכה
פורסם על ידי Kantesti Ltd, הרשומה באנגליה ובוויילס, מספר חברה. 17090423, לונדון, בריטניה.